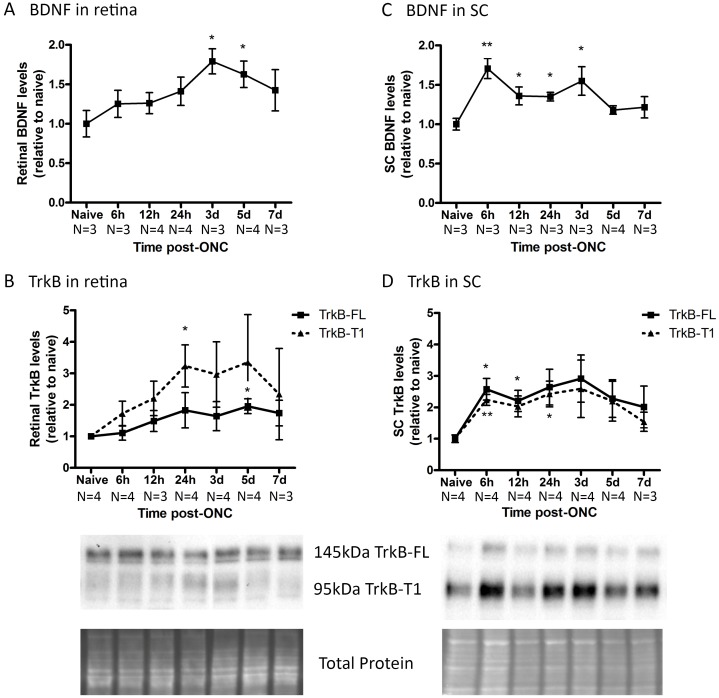
Fig 3. Endogenous BDNF and TrkB levels in retina and SC at various time points after ONC.
(A) In the retina, the total BDNF levels, analyzed via ELISA, rise upon ONC, reaching a peak at 3 to 5 d, attenuating afterwards. (B) The retinal TrkB-FL levels only slightly increase in the ONC model, while TrkB-T1 inclines more, reaching peak levels between 24 h and 5 d post-ONC. (C) In the SC, total BDNF concentrations are enhanced as soon as 6 h post-ONC and slowly decrease to baseline levels thereafter. (D) Collicular TrkB-FL and TrkB-T1 levels follow a very similar increase-decrease pattern after ONC induction, with the turning point situated around 3 d post-ONC. Key: BDNF, brain-derived neurotrophic factor; TrkB, tropomyosin receptor kinase B; TrkB-FL, TrkB full-length form; TrkB-T1, TrkB truncated form 1; SC, superior colliculus; ONC, optic nerve crush.

