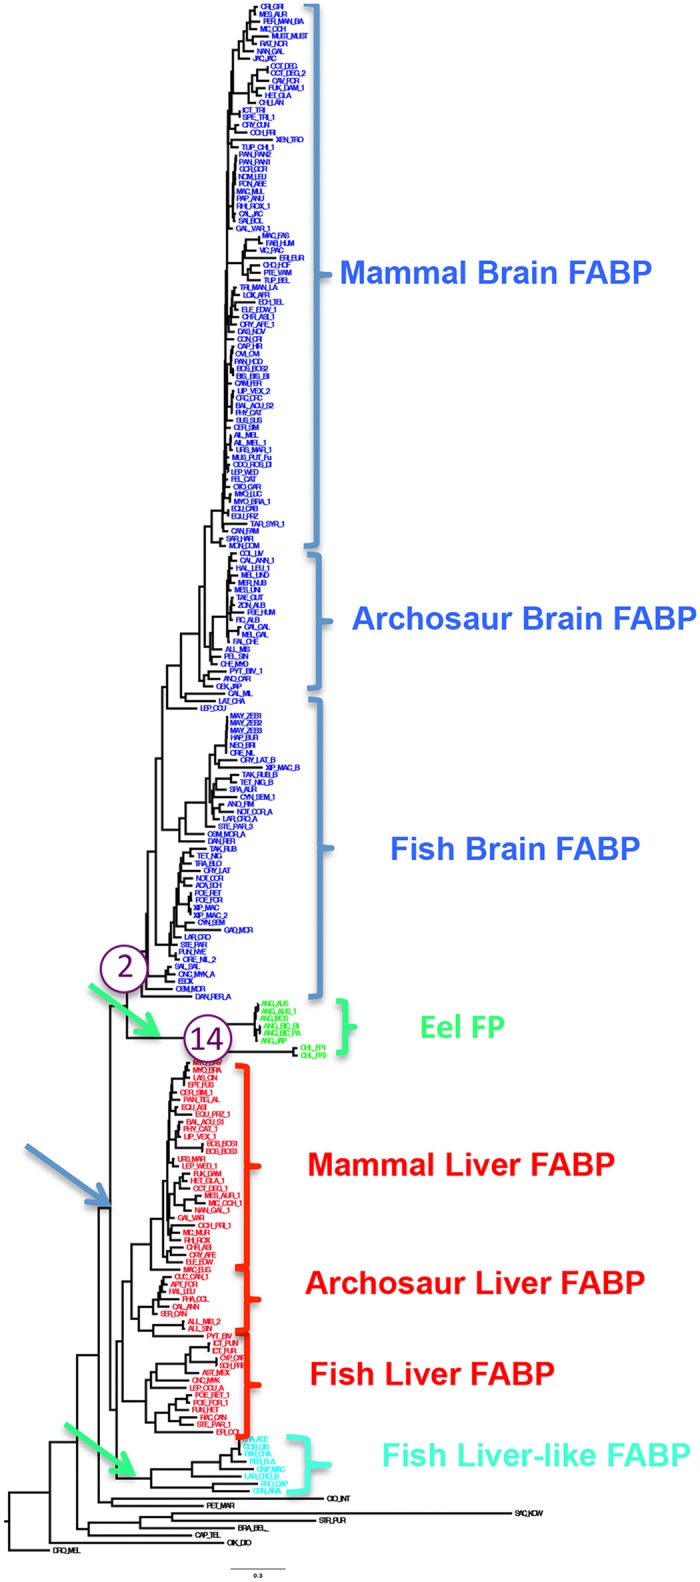
Fig 7. Phylogenetic tree generated by Maximum likelihood analysis in RaxML Blackbox.

See text for details of analysis. The arrows in the tree indicate potential branches where duplications occur to explain the paralog patterns in the gene family. The purple circles indicate the two branches where significant dN/dS skew occurs, and the number inside of the circle refers to the magnitude of the dN/dS skew.
