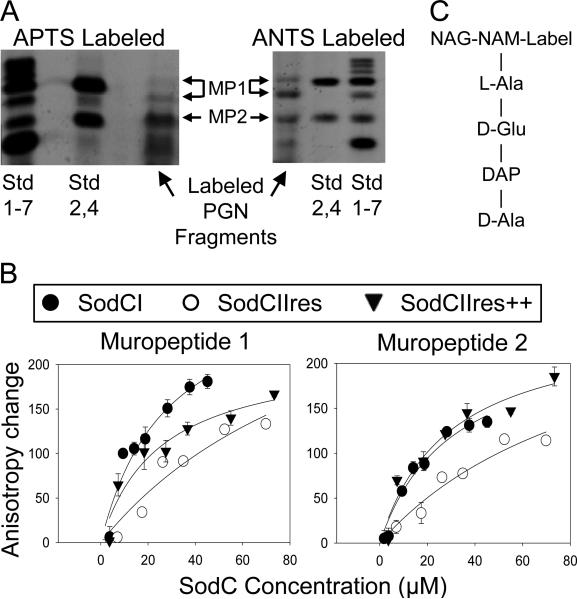
Figure 4. Fluorescence anisotropy analysis of SodC-muropeptide interactions.
A) Muropeptides were prepared from digested Salmonella PGN, labeled with the fluorescent dye APTS (left) or ANTS (right) and separated by electrophoresis through a 30% polyacrylamide gel. Standards (Std) are fluorescently labeled glucose (1), maltose (2), and additional glucose polymers to maltoheptaose (3-7). “Std 1-7” is comprised of all the labeled sugars, whereas “Std 2,4” contains labeled maltose and maltotetraose. Two different APTS labeled muropeptide derivatives were isolated (MP-1 and MP-2) and used in a fluorescence anisotropy assay. B) The isolated APTS-muropeptides were incubated with increasing amounts of purified SodCI, SodCIIres or SodCIIres++. The latter contains SodCI sequences in boxes 1 and 2. “Anisotropy Change” represents the difference between anisotropy values measured at each concentration of SodCI and the anisotropy measured with no added SodC. C) Schematic structure of labeled monomeric muropeptide.

