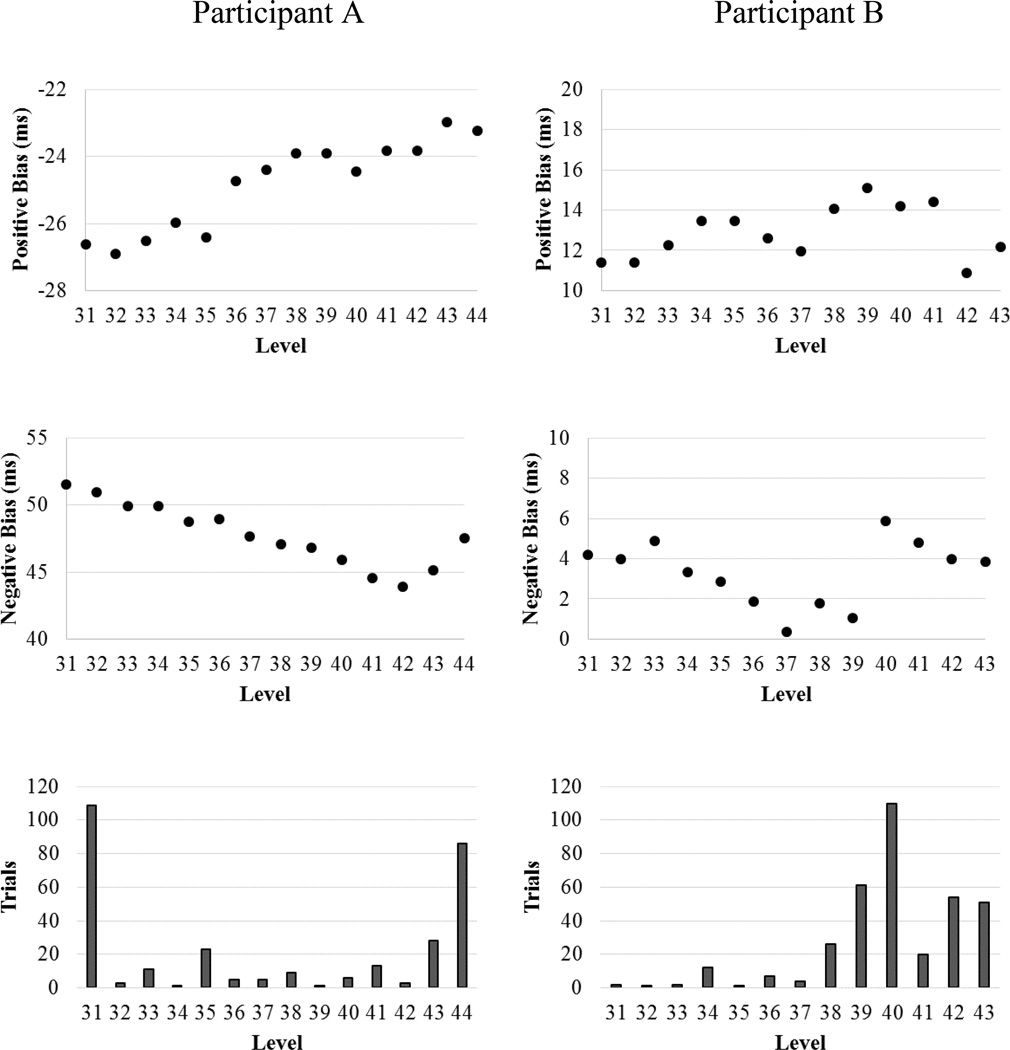
Figure 1.
Example graphical depiction of negative and positive attention bias scores as a function of level. Participant A (left column) demonstrates increased positive attention bias (middle figure; i.e., sustained attention with positive stimuli) and decreased negative attention bias (bottom figure; i.e., increased disengagement with negative stimuli) over the course of ABM training, while Participant B (right column) demonstrates minimal improvement in positive and negative attention biases. The bottom figures depit the number trials completed for each level of the ABM program.

