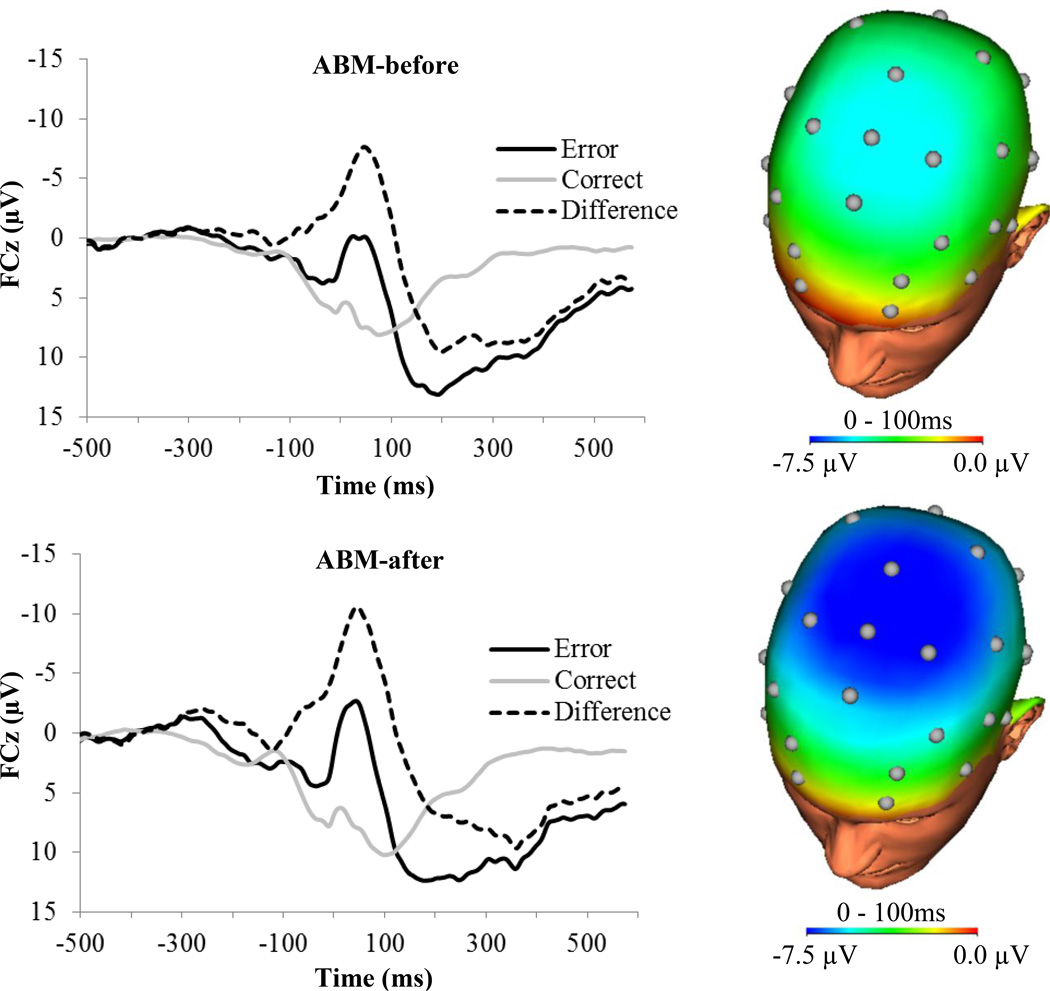
Figure 2.
ERP waveforms and head maps for ABM-before (top) and ABM-after (bottom) participants. The difference waveforms and head maps represent error minus correct trials. Head maps display the average activity between 0–100 ms after response. ABM = attention bias modification; ERP = event-related potential.

