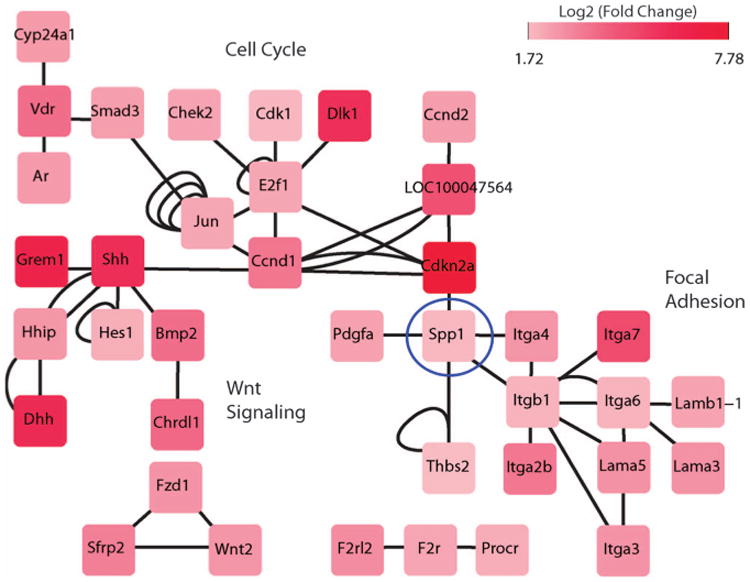
Figure 2.

Gene/protein interaction network of differentially expressed genes in NSynR53 in comparison with neurons. An interaction network was constructed from publicly available databases comprising of protein–protein interactions (KEGG, STRING, BioGRID) and genetic interactions (TRANSFAC). The differentially expressed genes were projected into this network that revealed a module showing association of genes related to the focal adhesion, cell cycle and the Wnt signaling pathways. The edges represent the interactions observed in various databases.
