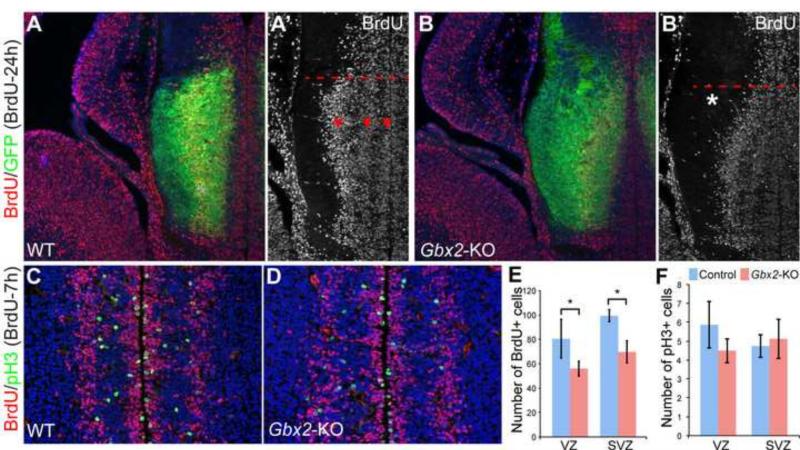
Figure 6. Loss of Gbx2 causes abnormal cell proliferation in the thalamus.
(A-F) Immunofluorescence on coronal sections of control and Gbx2-KO thalamus at E13.5 following BrdU chase or pulse labeling as indicated. Dashed lines demarcate the boundary between the thalamus and the epithalamus; arrowheads indicate the three stripes of BrdU+ cells parallel to the ventricular surface; the asterisk shows the abnormal curvature of the outer band of BrdU+ cells in the dorsal-most region of the thalamus due to the loss of Gbx2. (G-I) Histogram representation of quantification of proliferating and newly generated postmitotic cells. Asterisks indicate statistical significance (p<0.05, Student's t-test).

