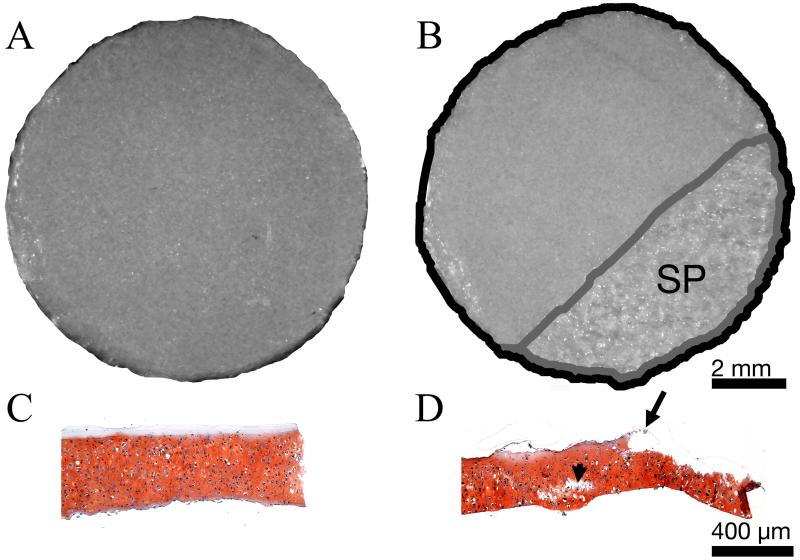
Figure 2. Quantification of surface peeling (SP) in flat configuration.
Representative stereomicroscope (A&B) and safranin O stained histological cross section (C&D) images of TE cartilage taken before (A&C), and after (B&D) exposure to frictional shear stress. Area exhibiting SP appeared mottled in stereomicroscope images (B). Damage was determined as the ratio of the area of SP (B, outlined in gray) to the total surface area (B, outlined in black). SP was also evident in histological cross sections (D, starting at the arrow and continuing the length of the section to the right). Internal cracking (arrowhead) is also seen in D. Scale bars in B and D also apply to A and C respectively.

