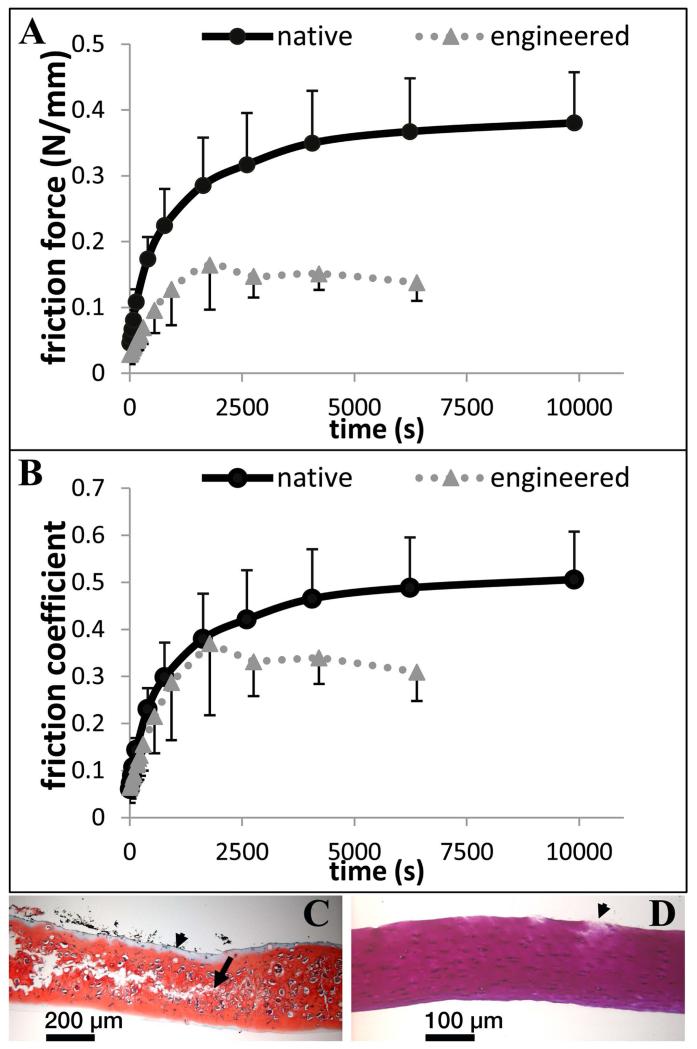
Figure 4. Friction measurements in curved test setup.
Friction force (A) and coefficient of friction (B) data for TE and native cartilage. C) Representative safranin O stained histological cross section of TE cartilage. Internal cracking (starting at the arrow and continuing left) is evident. Adhesive can be seen as the unstained region on the upper surface of the tissue (arrowhead). India ink was used to mark the adhered side of the tissue, and can be seen as black fragments near the upper surface. D) Representative toluene blue stained histological cross section of native cartilage. Minimal damage to the upper (adhered) surface of the specimen is shown (arrow).

