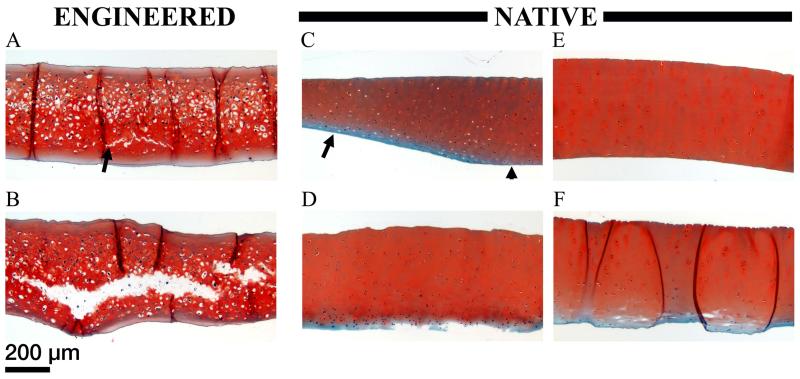
Figure 5. Damage characterization of TE and thinned native cartilage in the curved setup.
Safranin O stained histological cross sections of TE cartilage (A&B), native cartilage including the superficial zone (C&D), and native cartilage without the superficial zone (E&F), after exposure to frictional shear stress. The range of damage in each sample group is shown. A) Minimal cracking (arrow) observed in TE cartilage. B) Extensive cracking observed in TE cartilage. C) Narrowing of native cartilage including the superficial zone in the presumed loaded region (arrow), as opposed to the presumed unloaded region (arrowhead). D) Wear of native cartilage including the superficial zone. E) No apparent damage to native cartilage without the superficial zone. F) Minimal cracking (white space within the tissue) observed in native cartilage without the superficial zone. The dark lines running vertically through this sample section are sectioning artifacts (folds). All images are presented at the same scale.

