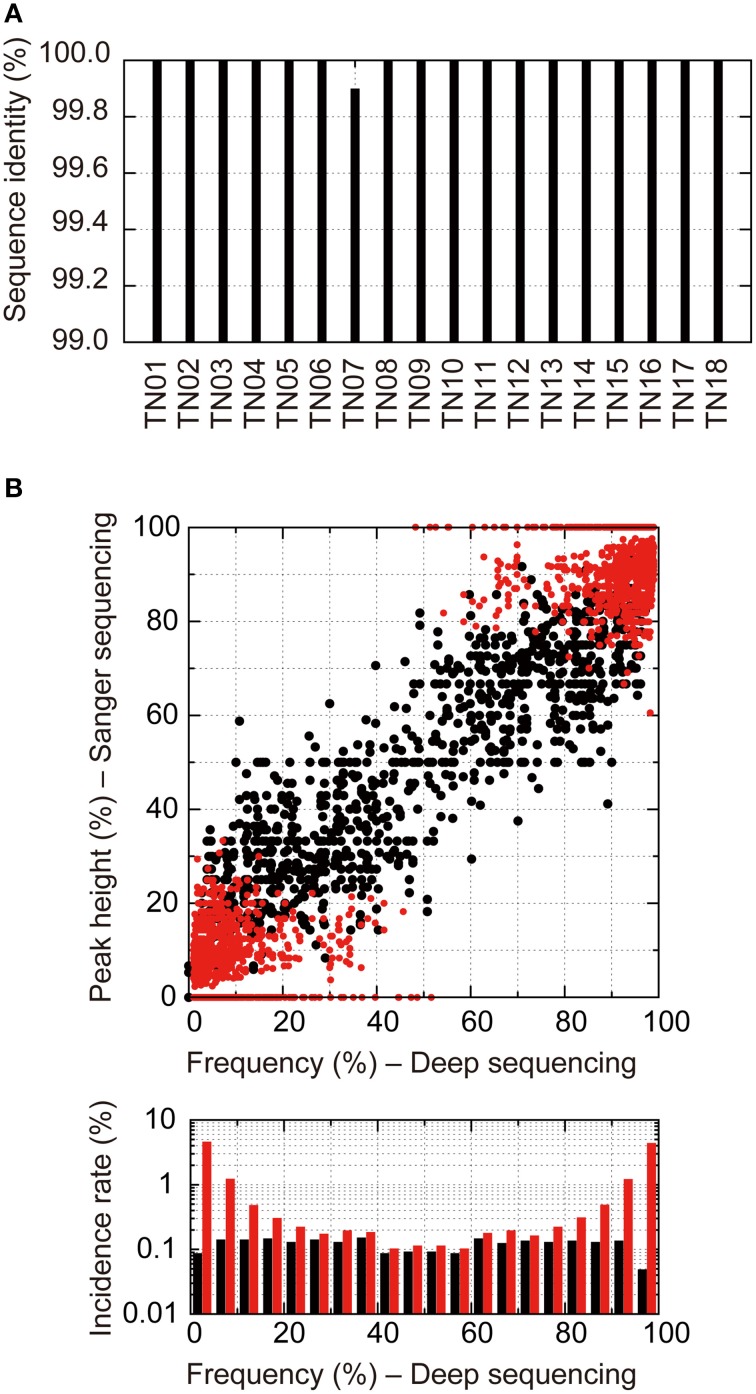
Figure 5.
Direct Sanger sequencing and deep sequencing comparison of 18 treatment-naïve samples. (A) Identity of consensus nucleotide sequences at positions where A, T, G, or C was detected by Sanger sequencings between the two methods. (B) Correlation of occupancies of bases at the positions where multiple bases at >1% prevalence were detected by deep sequencings between the two methods. For Sanger sequencing, occupancies of bases were estimated from their electropherogram peak heights. Black dots show mixture bases assigned from Sanger sequencing electropherograms. Red dots show mixture bases that were unassigned by Sanger sequencing but were identified by the deep sequencing method. Bottom graphs represent histograms of occupancies detected by the deep sequencing method. The black and red bars show incident rates detected by Sanger sequencings and those detected only by deep sequencing methods, respectively.

