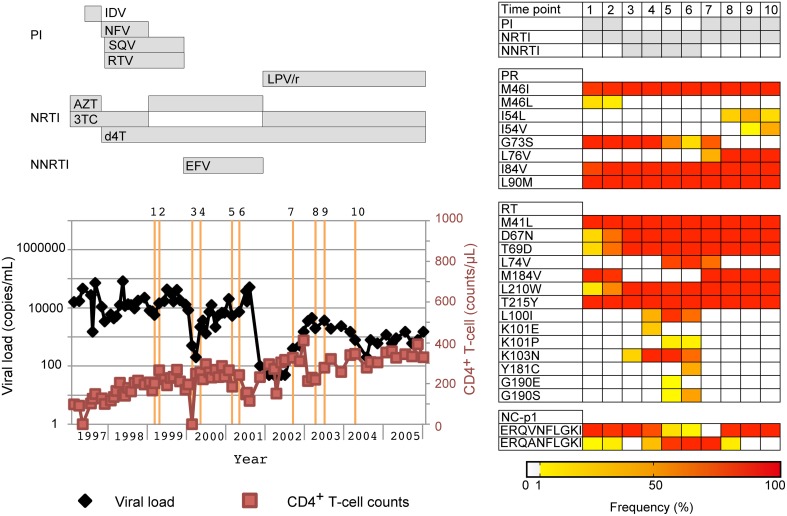
Figure 6.
Application of our deep sequencing method in examination of chronological population changes of drug-resistance mutations. Chronological changes in viral loads, CD4+ T-cell counts, and occupancies of drug-resistance mutations for a patient who failed a PI-containing regime. In the left graph, viral loads and CD4+ T-cell counts are shown in black and light red lines, respectively. Collection dates of analyzed samples are highlighted in orange perpendicular lines. Over the orange line, the identification numbers for the collection dates are also shown. At the top of the graph, periods when drugs were used are shown in horizontal bars. Furthermore, population dynamics of resistance related mutations are shown on the right of the graph. The occupancies of the mutations are highlighted with colors according to the bottom bar. PI, PR inhibitor; NRTI, nucleoside/nucleotide RT inhibitor; NNRTI, non-nucleoside RT inhibitor. IDV, indinavir; NFV, nelfinavir; SQV, saquinavir; RTV, ritonavir; LPV/r, lopinavir boosted with ritonavir; AZT, azidothymidine; 3TC, lamivudine; d4T, stavudine; EFV, efavirenz.

