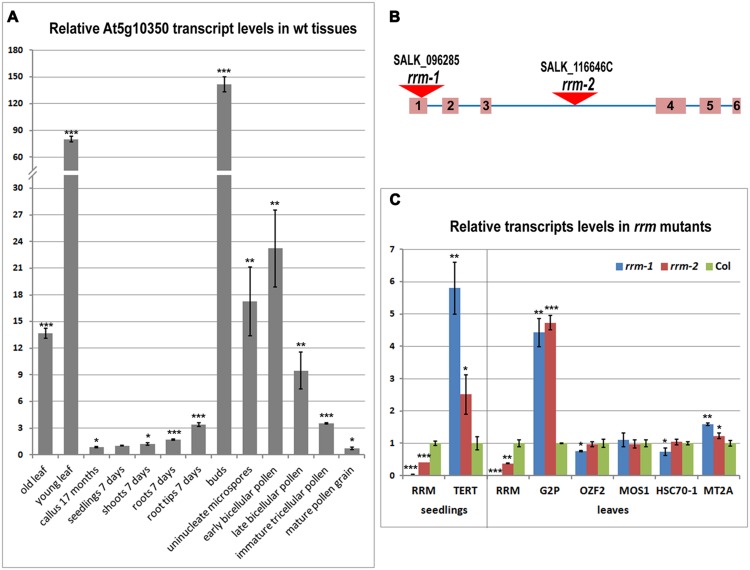
FIGURE 3.
Transcription profile of the RRM gene in tissues of wild-type plants and relative transcription of the RRM interactors in rrm mutants. (A) Level of RRM transcripts in various wild-type (wt) plant tissues and developmental stages calculated relative to 7-days-old seedlings (Col-0) using the ΔΔCt method and ubiquitin (ubi10) as a reference gene. (B) Schematic depiction of the RRM gene and position of the T-DNA insertion in homozygous mutant Arabidopsis lines rrm-1 and rrm-2. (C) Level of transcripts of indicated genes in 7-days-old seedlings (left panel) and 21-days-old leaves (right panel) of rrm-1 and rrm-2 T-DNA insertion lines calculated relative to wild-type (Col-0) using the ΔΔCt method and ubi10 as a reference gene. Two-tailed p-values were calculated using the unpaired t-test (∗p < 0.05; ∗∗p < 0.001; ∗∗∗p = 0.0001, see Supplementary Table S2 for details).

