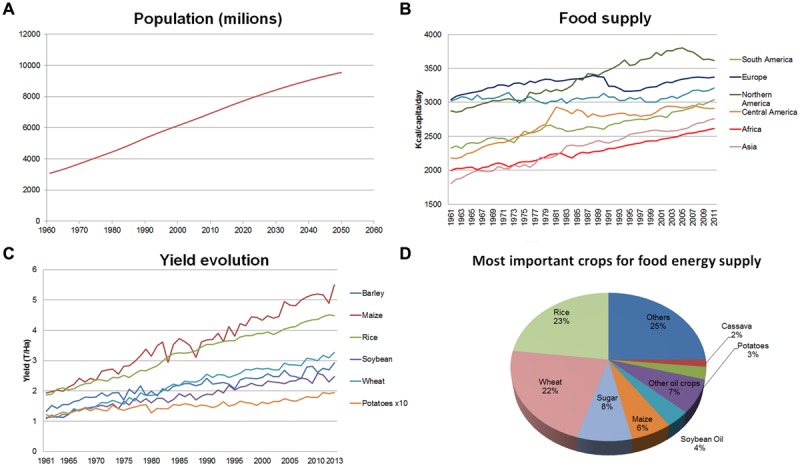
FIGURE 1.

Global population, food supply and crop yield trends. (A) World population since 1960 to 2050. (B) Food supply (Kcal/capita/day) in different regions of the world since 1961 to date. (C) Yield evolution for primary crops since 1960. (D) Most important crops for food energy supply. All data taken from FAO-STAT (http://faostat3.fao.org/home/E). Figures ellaborated by the authors from FAOSTAT data (FAOSTAT, 2015).
