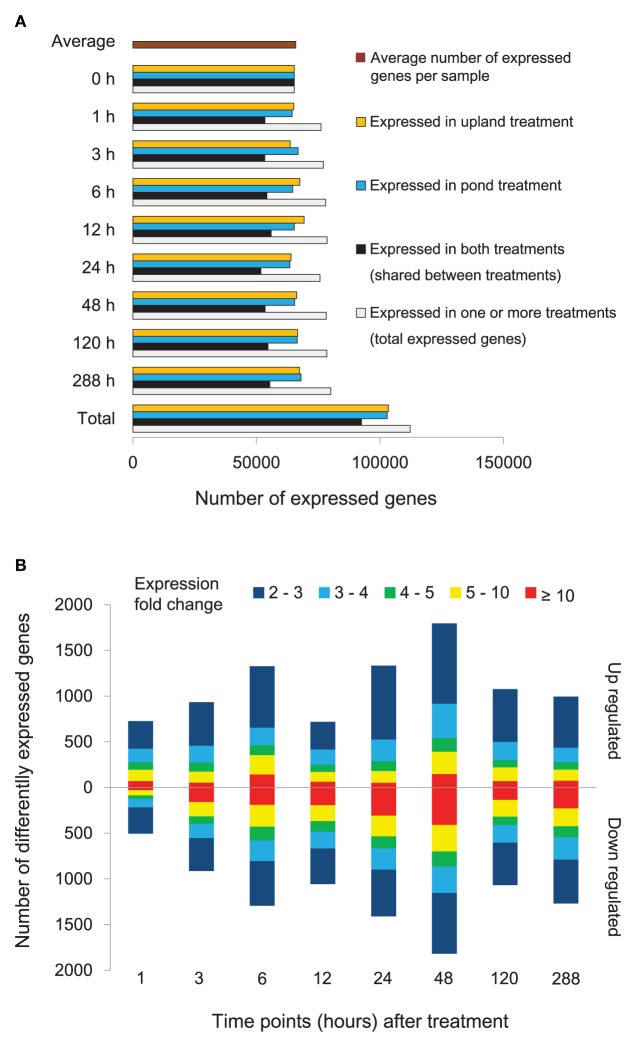
Figure 2.
Gene expression of Alternanthera philoxeroides in contrasting hydrological habitats. (A) Number of unigenes expressed at different time points under the pond and upland treatments. (B) Genes exhibiting differential expression between the pond and upland treatments at different time points. Bars pointing up and down indicate the number of genes whose expression was up- or down-regulated in the pond treatment relative to the upland treatment, respectively. Fold changes in expression are color-coded.

