
Figure 6.
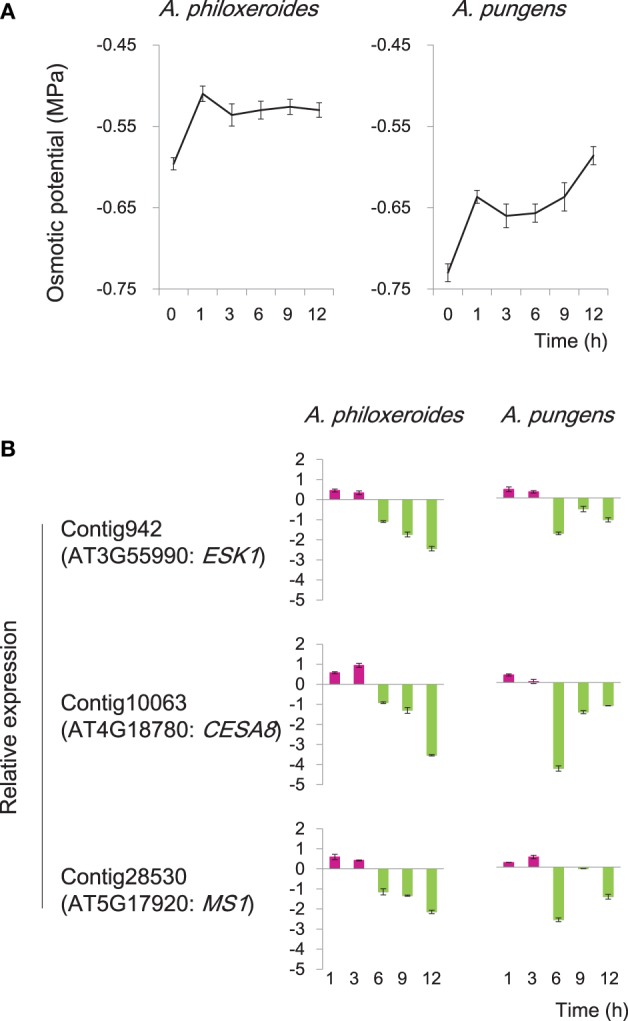
Variation in cellular osmotic potential following submergence in A. philoxeroides and A. pungens. (A) Trends in the cell sap osmotic potential during the pond treatment in both species. Quoted values are means + s.d., n = 8. (B) Expression patterns of genes involved in osmotic stress responses during the pond treatment. Relative expression levels were calculated as log2(pond/upland). Quoted values are means + s.d., n = 3. The names of Arabidopsis homologous genes were shown in parentheses: ESK1, ESKIMO 1; CESA8, cellulose synthase A8; MS1, methionine synthase 1.