Figure 6.

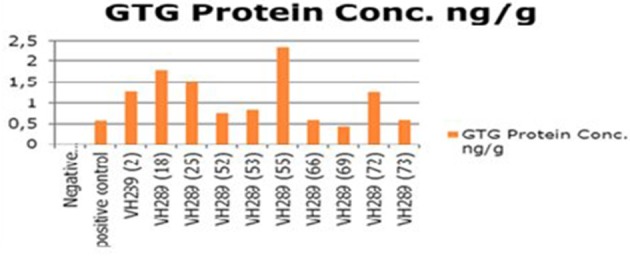
Concentration of GTG protein of transgenic cotton plants at T0 generation. Lane 1 represents control cotton plant; Lane 2 shows positive control; Lane 3–12 represent cotton plants.

Concentration of GTG protein of transgenic cotton plants at T0 generation. Lane 1 represents control cotton plant; Lane 2 shows positive control; Lane 3–12 represent cotton plants.