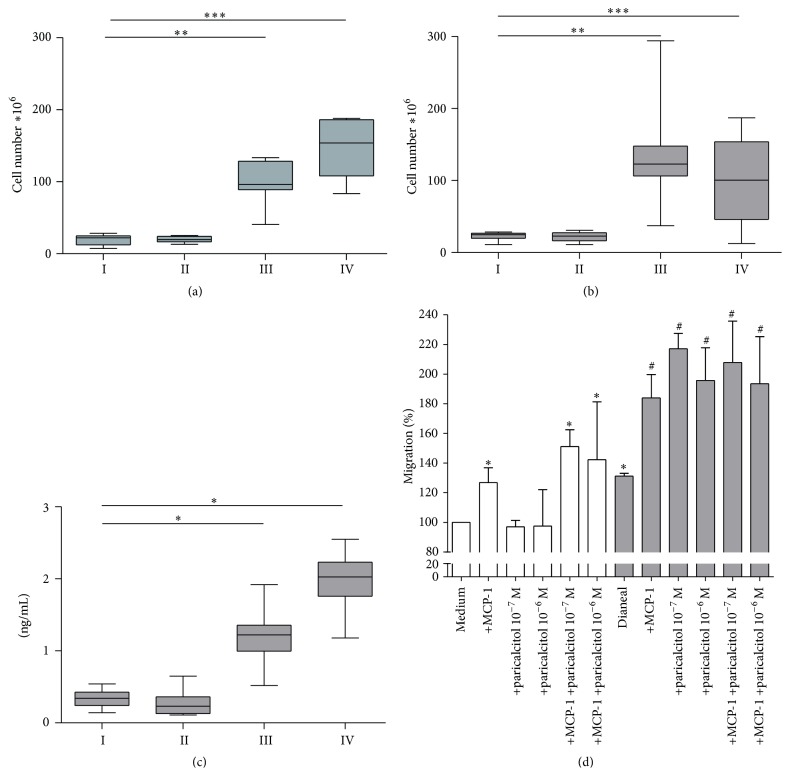
Figure 3.
Cell numbers and macrophage migration. Total peritoneal cell number in effluent after 90-minute PET with 30 mL of conventional PD fluid after five (a) and seven (b) weeks of treatment; ∗∗ p < 0.01; ∗∗∗ p < 0.001. Effluent concentration of MCP-1 after five weeks of treatment (c); ∗ p < 0.05. Rat macrophage migration towards paricalcitol; MCP-1 in standard medium (white bars) or medium containing Dianeal (1 : 4) (grey bars; (d) ∗ p < 0.05 versus medium; # p < 0.05 versus Dianeal + medium).

