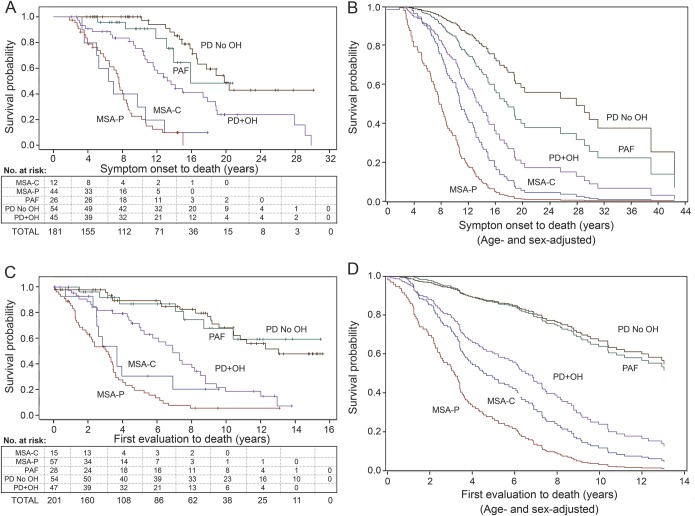
Figure 3. Survival plots and numbers of at-risk patients in α-synucleinopathies.
Displayed are survival probabilities expressed as a function of years since symptom onset (A and B) or initial evaluation at the NIH Clinical Center (C and D). (A and C) Kaplan-Meier plots and numbers of at-risk living patients. (B and D) Survival plots after adjustment for age and sex. “Censored” at-risk patients were alive as of the indicated years. MSA-C = cerebellar multiple system atrophy; MSA-P = parkinsonian multiple system atrophy; OH = orthostatic hypotension; PAF = pure autonomic failure; PD = Parkinson disease.

