. 2015 Nov 7;17(41):27380–27390. doi: 10.1039/c5cp04352b

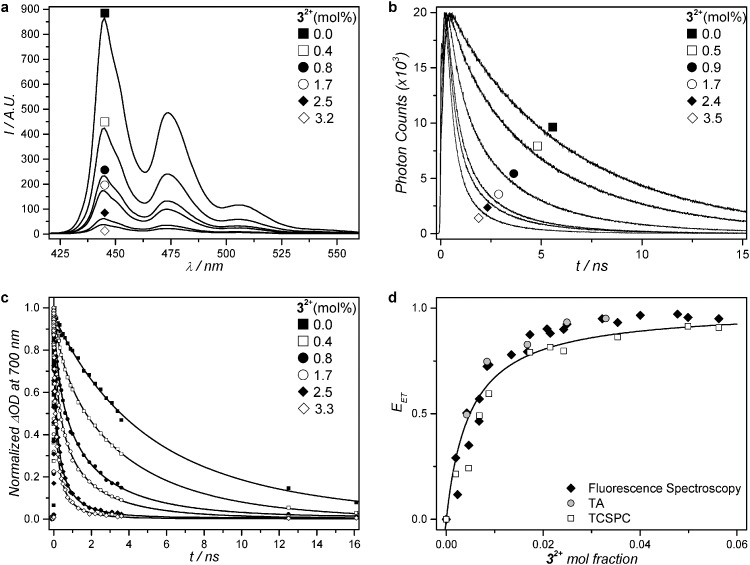
Fig. 3. Steady-state fluorescence spectra (a) and excited state time decays of 2 (b and c) for a series of PEGylated (4 mol%) DMPC liposomes containing a fixed amount of compound 2 (0.5 mol%) and 0 to 4 mol% of compound 32+ at 293 K. (a) Steady-state fluorescence spectra (λ exc = 400 nm, [2] = 1 μM). (b) Fluorescence decay curves from time-correlated single photon counting (λ exc = 440 nm, λ emi = 474 nm, [2] = 1 μM). (c) Normalized transient absorption kinetic traces at 700 nm. Best-fit curves drawn as solid lines for samples with addition of 32+ according to a three-dimensional Förster decay model (see ESI). For the sample without addition of 32+, the fit curve represents a bi-exponential decay model. (d) Energy transfer efficiency (E ET) as a function of the mole fraction of 32+ at 293 K, calculated from time-correlated single photon counting data (empty squares), transient absorption data (grey filled circles), and steady state fluorescence spectroscopy (black filled diamonds). Best-fit curve according to a Stern–Volmer model (see ESI).

Fig. 3