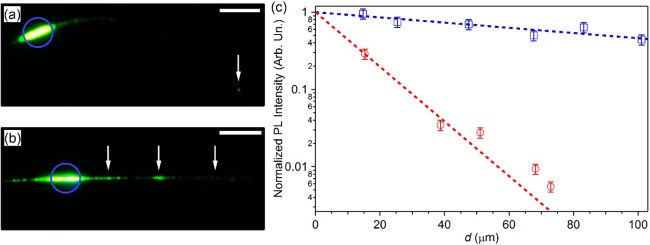
Figure 6.
(a, b) Micrographs of individual F8BT fibers, spun in controlled atmosphere (a) and in air (b), and excited by a focused laser spot (blue circles). Scale bars =20 μm. White arrows in (a) and (b) indicate the fiber tip and the defects and dishomogeneities along the fiber axis, respectively. (c) Spatial decay of the light intensity waveguided along a single fiber vs distance, d, from the excited region. Squares (circles): fibers electrospun in controlled atmosphere (air). Dashed lines: best fits to exponential decays.

