
Figure 1. Characterization of microinjection into K562 cells.
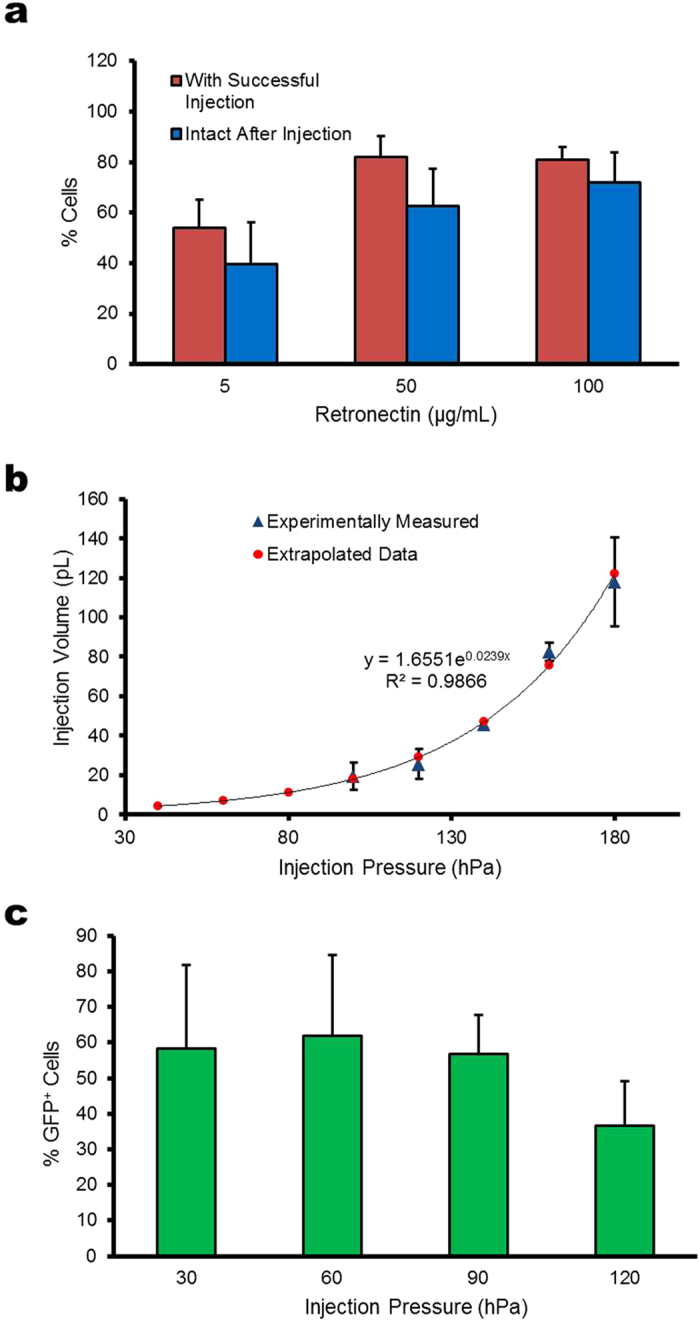
(a) Percentage of successfully injected (red bars) and cells intact after injection (blue bars) on polystyrene surfaces coated with solutions containing different initial concentrations of retronectin. Intact cells are defined as retaining dextran fluorescence 2 hours after injection. Each experiment consisted of 30–40 cells injected at each initial coating concentration. Bars represent the mean of 4 independent experiments ± the standard deviation. (b) Plot of injection volume for different injection pressure settings. The injection volume was estimated experimentally by performing injections of dye labeled dextran into a droplet of mineral oil. The injected sphere was estimated using the equation:  , for pressure settings between 100–180 hPa, where
  is the radius of the injected solution measured using a micrometer. The equation for the best fit exponential curve was used to estimate the injection volume for pressure settings below 100 hPa. (c) Plot of the percentage of injected cells with observable GFP expression at 24 hours after injection with different pressure settings. Bars represent the mean percentage of GFP expressing cells out of 35–56 cells injected ± the standard deviation for 4 independent experiments.