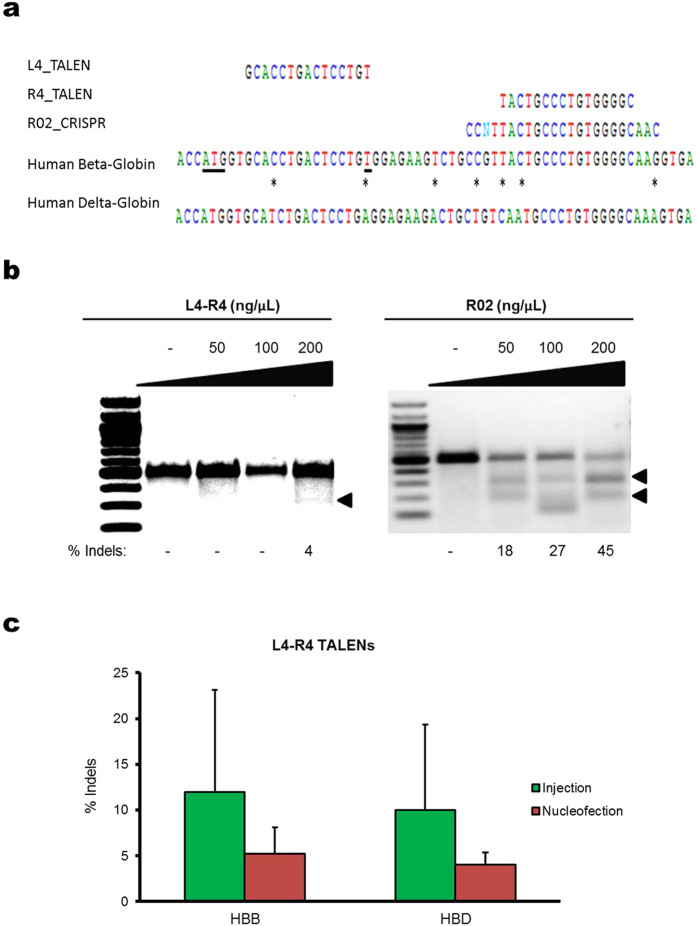
Figure 2. Gene editing by HBB-targeting nucleases using microinjection.
(a) Schematic showing targeting sequences of L4-R4 TALEN pair and R02 CRISPR guide RNA aligned to HBB and HBD. The CRISPR guide RNA is shown complementary to the reverse strand and is listed to the right of the PAM sequence. The ATG start codon and the sickle cell mutation are underlined. Asterisks between HBB and HBD indicate mismatches. The A, T, C, and G nucleotides are shown in green, red, blue, and black respectively for clarity. (b) Nuclease-induced indel rate as a function of plasmid concentration. Plasmids encoding L4-R4 TALENs or R02 CRISPR/Cas9 were microinjected into K562 cells with an injection volume of 7 pL and the nuclease-induced cleavage at HBB was analyzed using the T7E1 assay. Shown is a comparison of the indel rates by L4-R4 TALENs and R02 CRISPR/Cas9 system at plasmid concentrations of 50, 100 and 200 ng/μL. (c) Comparison of indel rates at HBB and HBD induced by the L4-R4 TALEN pair delivered using microinjection and nucleofection. Green and red bars represent mean percent indels in microinjected and nucleofected cells respectively. The indels shown for microinjected cells represent the average of 58 single cell clones pooled together per sample. N = 3 for cells microinjected and nucleofected with L4-R4 TALENs.

