
Figure 1.
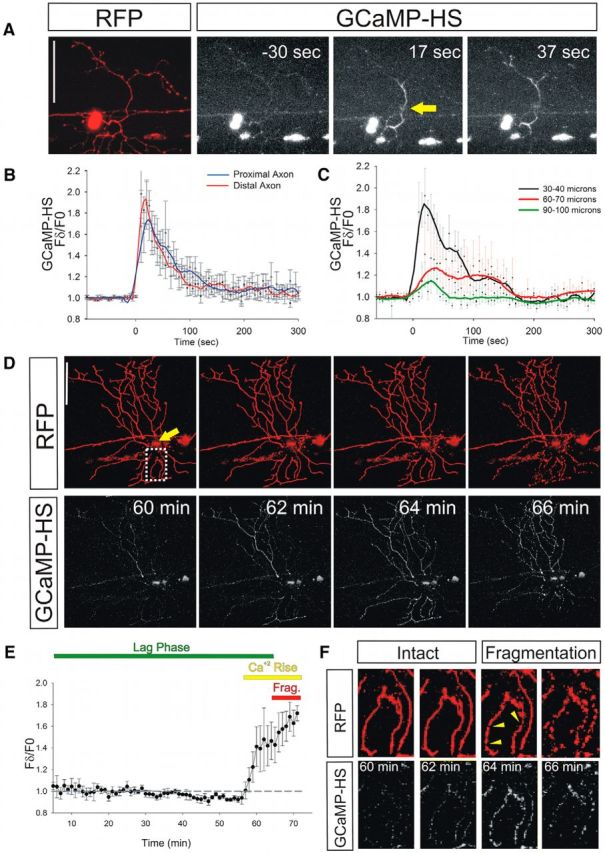
Cytoplasmic calcium rises immediately after axotomy and immediately before axon fragmentation. A, RB neuron in a 2 dpf zebrafish larva expressing DsRed (left) and GCaMP-HS (3 right) before (−30 s) and after (17 and 37 s) laser axotomy. GCaMP-HS fluorescence traveled as a wave away from the axotomy site toward both the cell body and into the axon fragment. Arrow points to the axotomy site. Scale bar, 100 μm. B, Plot of relative GCaMP-HS fluorescence intensity changes in regions 50 μm distal and proximal to the axotomy site (n = 12). The GCaMP-HS fluorescence waves were similar in distal and proximal directions. C, Plot of relative GCaMP-HS fluorescence intensity changes at several distances from the axotomy site in the distal axon fragment (n = 12). The GCaMP-HS fluorescence waves diminished in magnitude with distance from the axotomy site. The average velocity of GCaMP-HS fluorescence waves was 2.66 μm/s, measured as time to fluorescence peak. D, RB neuron in a 2 dpf zebrafish larva expressing DsRed and GCaMP-HS. Times after axotomy are indicated in minutes. GCaMP-HS fluorescence rose minutes (62–64 min) before fragmentation (64–66 min). Arrow points to the axotomy site. Scale bar, 100 μm. E, Plot of GCaMP-HS fluorescence intensity changes throughout the lag phase, starting 5 min after axotomy, measured in 1 min intervals (n = 4 neurons in 4 fish). GCaMP-HS fluorescence rose minutes before fragmentation. Frag, Fragmentation. F, Magnification of a separated branch of the axon shown in D; magnified area corresponds to the dotted box. Note that calcium increased between 60 and 62 min after axotomy, but signs of fragmentation (arrowheads) were not apparent until 64 min after axotomy.