
Figure 2.
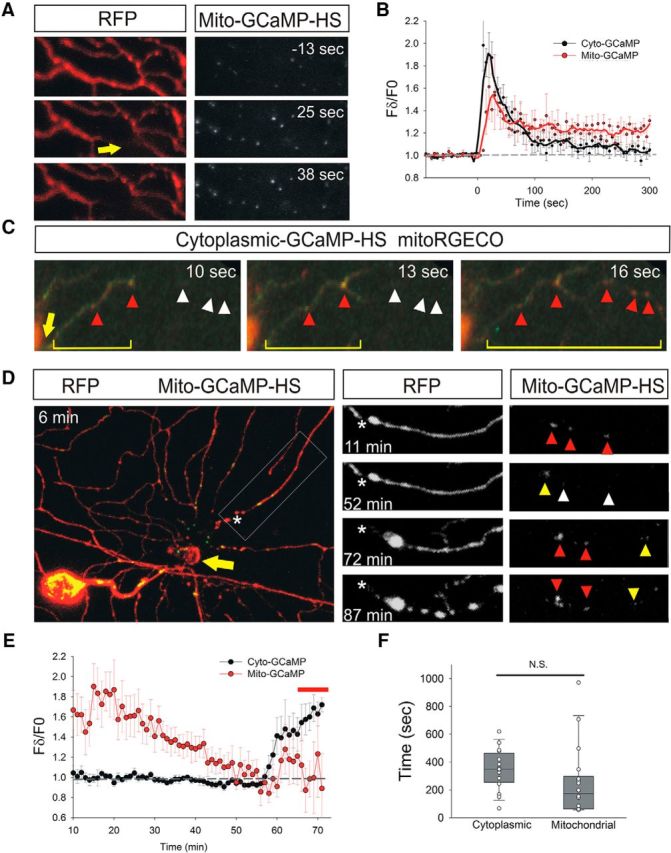
Mitochondrial calcium increases after cytoplasmic calcium influx induced by axotomy and just before fragmentation. A, Peripheral axon arbor of an RB neuron in a 2 dpf zebrafish larva expressing DsRed and Mito-GCaMP-HS before (−13 s) and after (25 and 38 s) laser axotomy. Mito-GCaMP-HS fluorescence intensity rose in mitochondria near axotomy site (arrow). B, Plot comparing relative fluorescence intensity changes in GCaMP-HS and Mito-GCaMP-HS in regions 50 μm distal to the axotomy site (n = 9 neurons for GCaMP-HS and 12 neurons for Mito-GCaMP-HS). The Mito-GCaMP-HS fluorescence rose with similar kinetics in the cytoplasm and mitochondria, but remained elevated for longer in axonal mitochondria. C, Spatial comparison of calcium rises in cytoplasm (GCaMP-HS, green) and mitochondria (mitoRGECO, red) after axotomy (indicated in seconds). Arrow points to site of axotomy, bracket indicates extent of cytoplasmic calcium wave, red arrowheads indicate mitochondria with elevated calcium, and white arrowheads indicate locations of mitochondria with baseline calcium. Note that mitochondrial calcium increases followed cytoplasmic calcium increases. D, RB neuron in a 2 dpf zebrafish larva expressing RFP and Mito-GCaMP-HS after axotomy. Times after axotomy indicated in minutes. Arrow indicates axotomy site. Area boxed in left panel is magnified in the right panels. Asterisk indicates proximal end of the severed axon branch. Arrowheads point to mitochondria in the magnified panels: red arrowheads indicate mitochondria with high GCaMP fluorescence, yellow indicates intermediate fluorescence, and white indicates low fluorescence. Note that calcium diminished between 11 and 52 min after axotomy, just before fragmentation. Fragmentation has just begun at the 72 h time-point in this axon. E, Plot comparing relative fluorescence intensity changes in GCaMP-HS and Mito-GCaMP-HS in regions 50 μm distal to the axotomy site, starting 10 min after axotomy, measured in 1 min intervals (n = 8 cytoplasmic measurements and 16 mitochondrial measurements). Note that Mito-GCaMP-HS fluorescence intensity diminished gradually through the lag phase, but increased minutes before fragmentation. Bar above graph indicates approximate time of fragmentation. F, Box plot showing duration of terminal calcium rise in cytoplasm and mitochondria starting when a calcium increase was first detected and ending when fragmentation was first detected (n = 16–18). Imaging intervals were 22–62 s for mitochondria and 29–135 s for cytoplasmic measurements. N.S., Not significant.