
Figure 1.
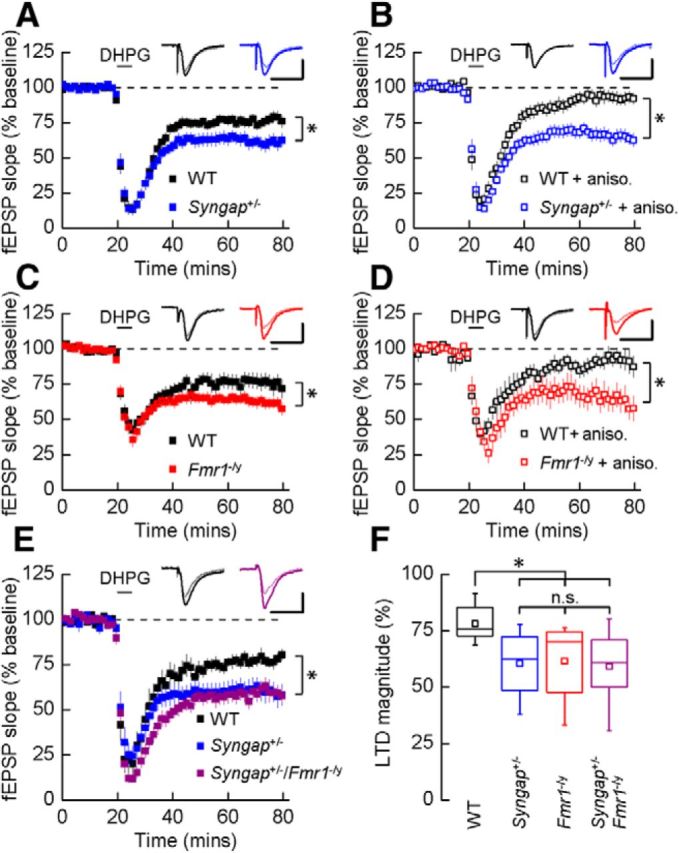
Syngap+/− phenocopies the hippocampal synaptic pathophysiology observed in Fmr1−/y mice. A, application of DHPG (50 μm) induced LTD that was significantly increased in Syngap+/− mice (62 ± 5%, n = 15; t test, p = 0.01) versus WT littermate controls (77 ± 3%, n = 18). Representative average fEPSPs before and after DHPG application are illustrated. B, In the presence of protein synthesis inhibitor anisomycin (aniso.; 20 μm), DHPG-induced LTD was not sustained in WT mice (91 ± 4%, n = 12), while remaining intact in Syngap+/− mice (64 ± 4%, n = 14). C, DHPG-induced mGluR-LTD was also significantly enhanced in Fmr1−/y mice (63 ± 4%, n = 17; t test, p = 0.04) versus WT littermate controls (77 ± 5%, n = 17). D, In the presence of anisomycin, mGluR-LTD remained at a similar magnitude in the Fmr1−/y (65 ± 7%, n = 9), whereas LTD could not be sustained in WT mice (91 ± 6%, n = 8). E, The magnitude of LTD was significantly enhanced in the Syngap+/−/Fmr1−/y double mutant mice (59 ± 4%, n = 12; ANOVA, p = 0.02) relative to WT littermate controls (78 ± 3%; n = 9). No significant differences were observed in LTD magnitude between the Syngap+/−/Fmr1−/y double mutant mice and either Syngap+/− (60 ± 4%, n = 10) or Fmr1−/y (62 ± 5%, n = 10; data not illustrated) single mutant mice. F, Summary of DHPG-induced LTD for each of the four genotypes generated from the Syngap+/− × Fmr1−/y cross. Box plots illustrate minima and maxima (whiskers), median (line), mean (square symbol), and interquartile range (box). Calibrations: A, D, 250 μV, 10 ms; B, C, 500 μV, 10 ms; E, 350 μV, 10 ms. n.s., Not significant. *p < 0.05.