
Figure 6.
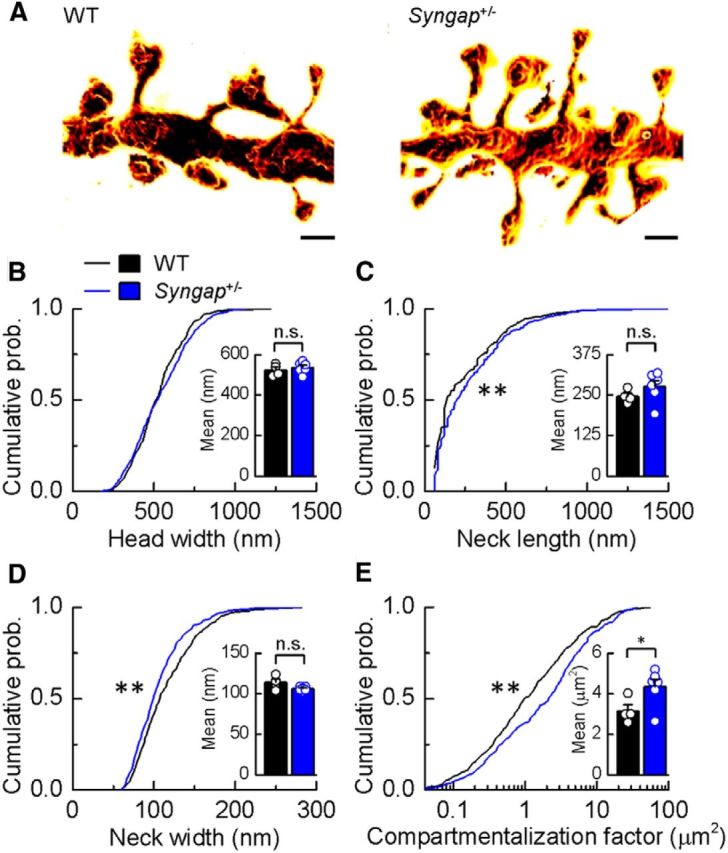
CA1 pyramidal neuron dendritic spine morphology in Syngap+/− mice. A, Surface-rendered STED images of apical dendritic segments from pyramidal neurons in the CA1 of the hippocampus of WT and Syngap+/− mice revealing morphological details that are invisible to conventional light microscopy. Scale bars, 500 nm. B–D, Kolmogorov–Smirnov tests of the cumulative frequency distributions show that the distribution profiles of spine head widths (B) are not significantly different between genotypes (p = 0.11), whereas distribution profiles of spine neck lengths and widths show that Syngap+/− mice (n = 424 spines) have significantly more spines with longer (C; p < 0.005) and narrower necks (D; p < 0.0008) compared to WT mice (n = 393 spines). The mean values for these parameters are, however, not significantly different (WT, 523 ± 14 nm, 246 ± 10 nm, 114 ± 4 nm, n = 4; Syngap+/−, 536 ± 11 nm, 276 ± 19 nm, 106 ± 1 nm, n = 6, for head width, neck length, and neck width, respectively). E, To predict the impact of these spine morphology changes on diffusional coupling, a morphological compartmentalization factor was calculated. The cumulative frequency distributions of the compartmentalization factor significantly differ between genotypes (Kolmogorov–Smirnov test, p < 0.0001), and this is also reflected in the mean values for each genotype (two-tailed independent t test with Welch's correction, p = 0.04; WT, 3.16 ± 0.30 μm2; Syngap+/−, 4.35 ± 0.37 μm2). n.s., Not significant; *p < 0.05; **p < 0.01.