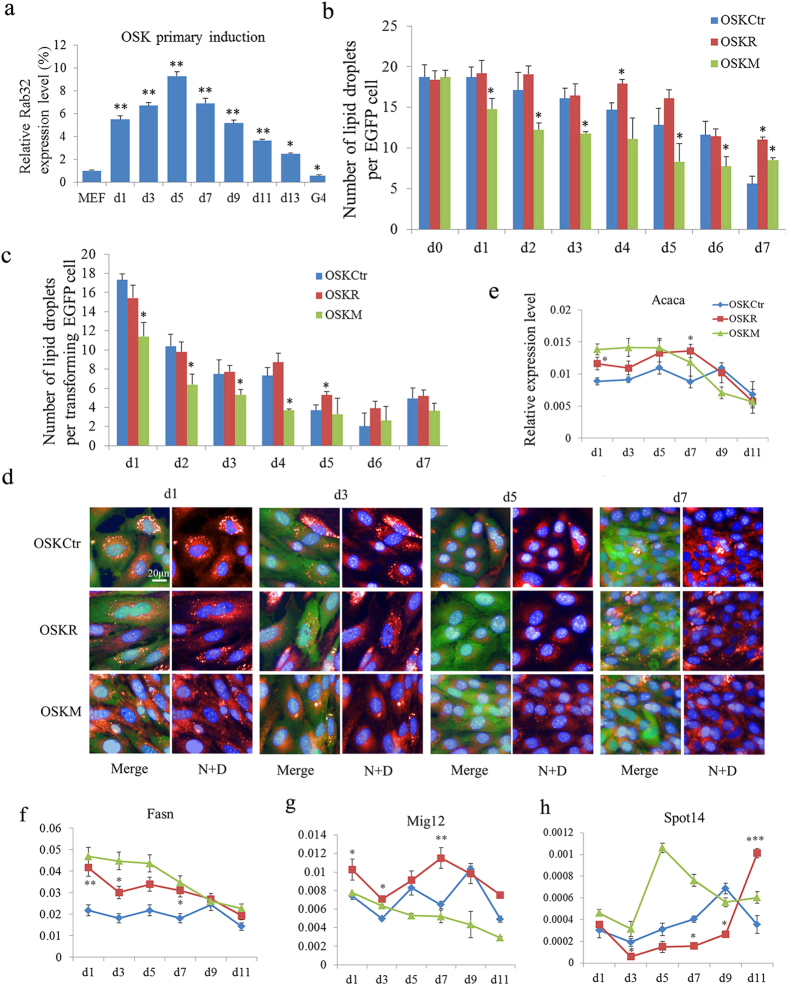
Figure 4. Rab32 Enhances Lipid Synthesis during Reprogramming.
(a) Rab32 is progressively up-regulated in OSK-induced iPSCs until 5 days post virus infection compared to MEFs; Rab32 expression is then downregulated. Relative expression was quantified using the comparative threshold cycle (Ct) method (2–ΔΔCt). The ΔCT was calculated using β-actin, EF1-α and α-tubulin as internal control. *p < 0.05; **p < 0.01. (b) Lipid droplets dots per EGFP cell were calculated and compared to the MEFs induced with OSKCtr on the same day (n = 3, the results of OSKCtr were used as control, *p < 0.05). (c) Lipid droplets dots per transformed EGFP cell were calculated and compared with the MEFs induced with OSKCtr on the same day (n = 3, the results of OSKCtr were used as control, *p < 0.05). (d) Representative images showing the change in the number of lipid droplets during reprogramming. Lipid droplets were stained with Nile red, and the nuclei were stained with DAPI in EGFP cells seeded on feeders (bar = 20 μm,N: Nile red, D: DAPI).(e–h) The expression levels of Acaca, Fasn, Mig12, and Spot14 were determined by qPCR on day 1, 3, 5, 7, 9 and 11 during reprogramming with OSKCtr, OSKR and OSKM. The data in Figure 4e–h, Fig. 5e–i, Fig. 6a–f are representative of three different experiments and are shown as M ± SD, n = 3, the results of OSKCtr were used as control, *p < 0.05, **p < 0.01. The gene expression profiles were expressed using the comparative CT (2−ΔCT) method. The ΔCT was calculated using β-actin, EF1-α, and α-tubulin as internal controls.

