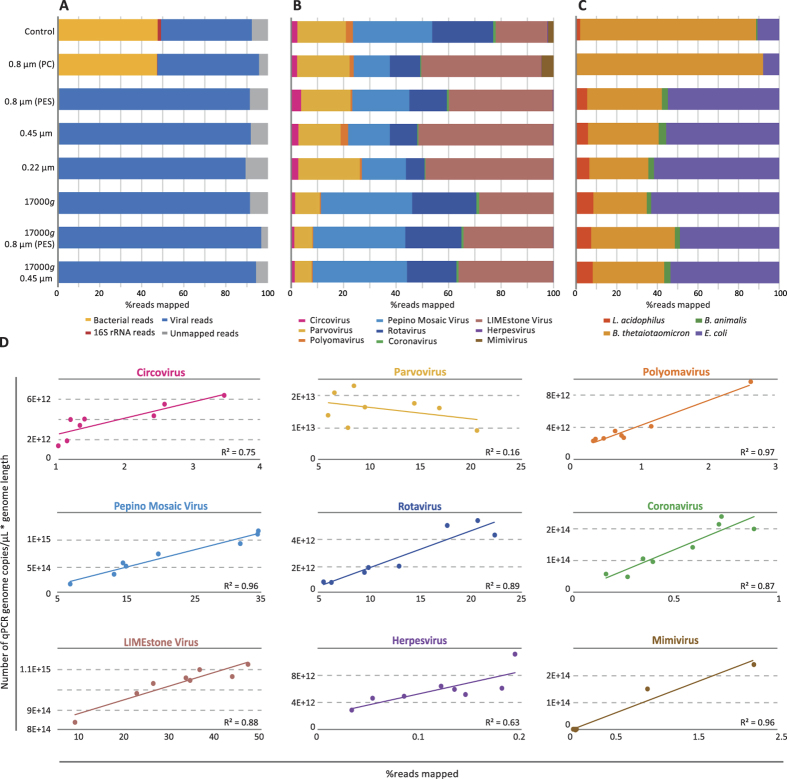
Figure 7.
Percentage of NGS sequencing reads for bacterial, 16S rRNA, viral and unmapped reads for the conditions tested (A). Distribution of NGS sequencing reads for the mock-virome (B) and bacterial mock-community (C). Correlation between the percentage of mapped reads obtained per virus and the number of virus genome copies after amplification/μL*genome length as measured with qPCR (D). Normalization of the number of reads to the genome length allows for a proper comparison with qPCR results.

