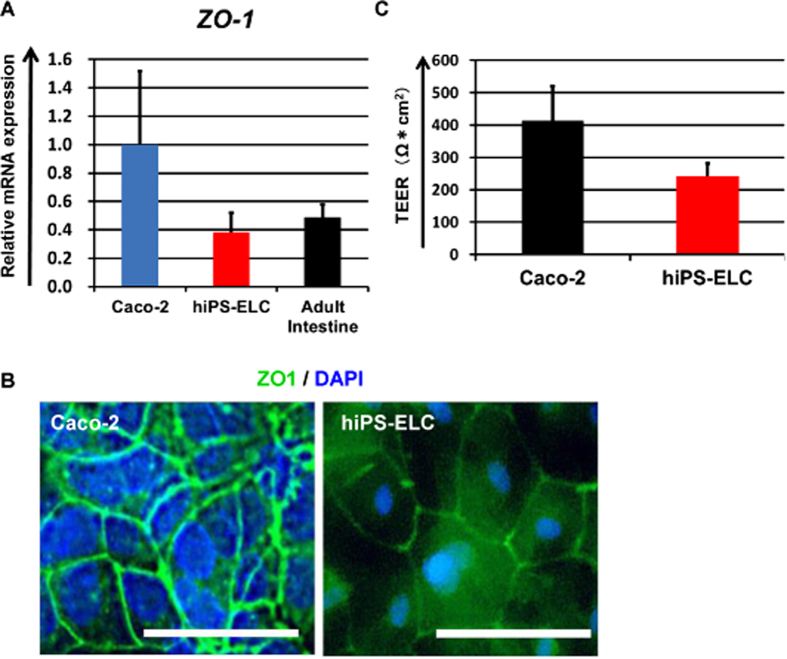
Figure 4. Analysis of barrier formation capacity in the human iPS-derived enterocyte-like cell monolayers.
(A) The gene expression levels of ZO-1 in Caco-2 cells, human iPS-derived enterocyte-like cells (hiPS-ELCs) and Adult Intestine were examined by real-time RT-PCR analysis. On the y axis, the gene expression levels in Caco-2 cells were taken as 1.0. (B) Immunostaining analysis of ZO-1 (Green) in the hiPS-ELCs and Caco-2 cells was performed. Nuclei were stained with DAPI (Blue). Scale bars represent 40 μm. (C) TEER values of Caco-2 cell monolayers and hiPS-ELC monolayers were measured by Millicell-ERS. All data are represented as the means ± S.E. (n ≧ 3).

