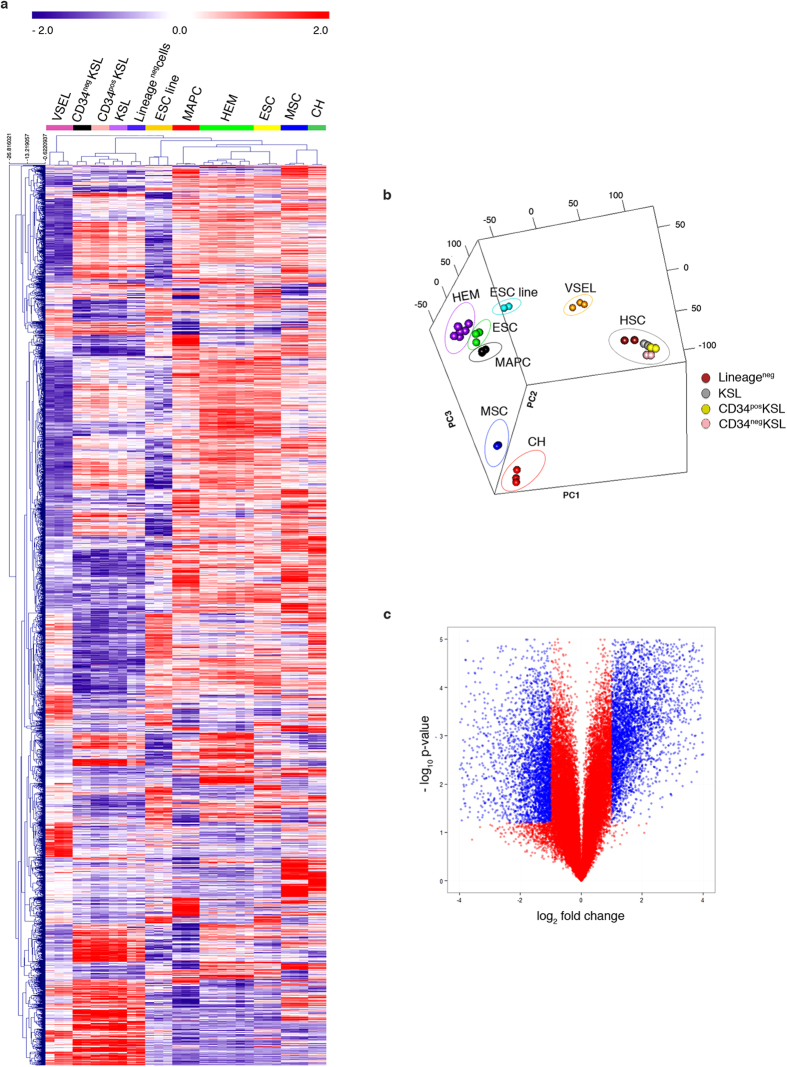
Figure 2. Characterization of CH cells by genome-wide microarrays.
(a) Dendrograms show the hierarchical clustering, based on differentially expressed genes, of embryonic stem cell (ESC) line, ESC primary culture, c-kit+Sca-1+lineage marker− cells (KSL), CD34neg KSL, CD34pos KSL, Lineageneg cells, hemangioblasts (HEM), very small embryonic-like stem cells (VSEL), multipotent adult progenitor cells (MAPC), mesenchymal stem cells (MSC), and CH cells. (b) Principal component analysis of the 5000 genes with highest standard deviation for the samples mentioned in panel (a). (c) Volcano plot shows gene expression differences between CH cells and MSC. Log 2 gene ratios are plotted against negative log 10 P values.

