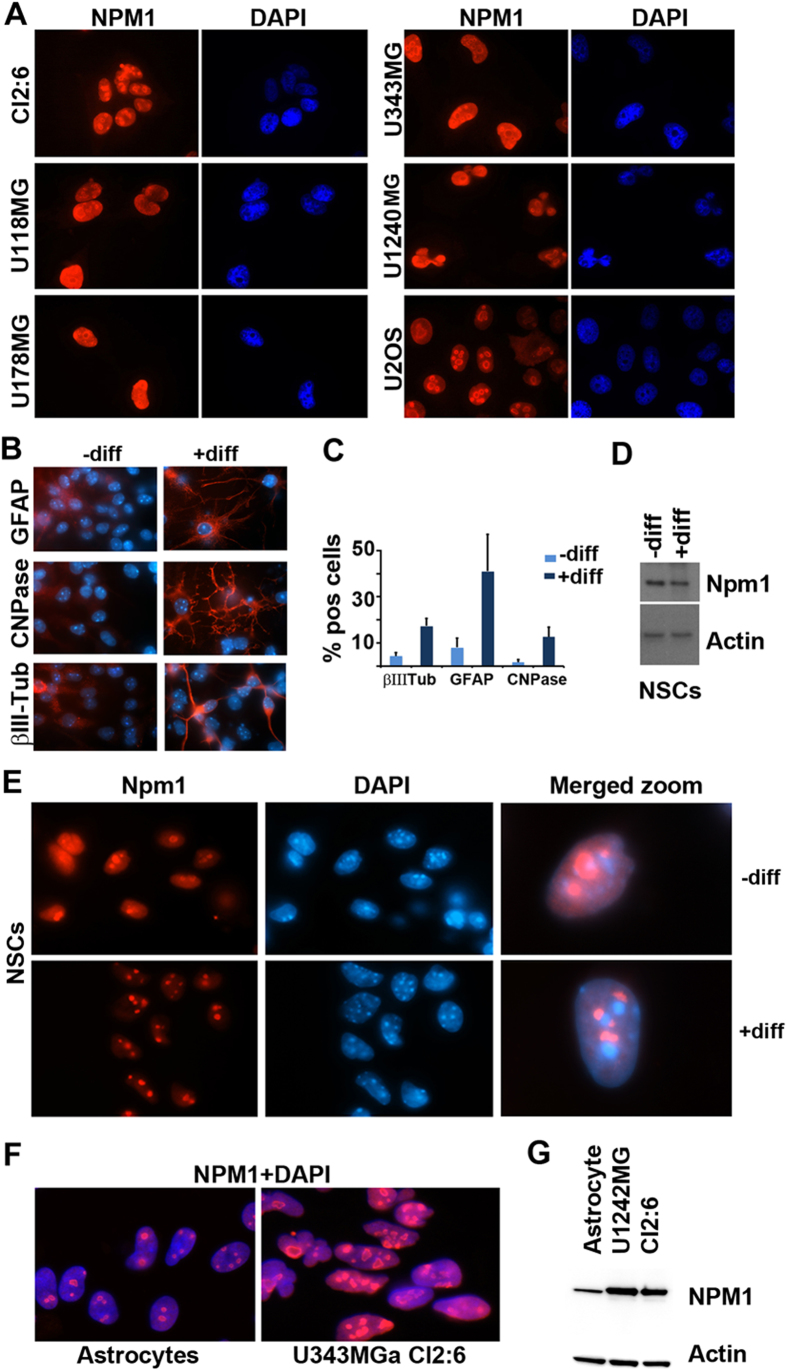
Figure 2. Levels and localization of NPM1 in human glioma cell lines and mouse neural stem cells.
(A) IF staining of NPM1 (red) in glioma cell lines as indicated in the figure. Nuclei were counterstained with DAPI (blue). U2OS osteosarcoma cells were used in comparison. (B) IF staining (red) of GFAP (astrocyte marker), CNPase (oligodendrocyte marker) and βIII-tubulin (neuronal marker) in either undifferentiated (–diff) or differentiated (+diff) mouse wild type NSCs. Nuclei were counterstained with DAPI (blue) and shown merged with the red signal. In this experiment, mouse NSCs were growing as spheres and thereafter dissociated onto laminin coated coverslips and induced to differentiate or maintained in an undifferentiated state. (C) Percentages of GFAP+, CNPase+, and βIII-tubulin+ cells in undifferentiated (–diff) or differentiated (+diff) mouse NSCs. Results are given as the average percentage (%) of cells expressing the respective marker and error bars represent the standard deviation. Shown is the result from one representative experiment performed in triplicate and 300 cells were evaluated for each marker and coverslip. (D) IB analysis of Npm1 in either undifferentiated (–diff) or differentiated (+diff) mouse NSCs. β-actin served as loading control. (E) IF staining of Npm1 (red) in undifferentiated (–diff) or differentiated (+diff) mouse NSCs. Right panel: merged (Npm1+DAPI) zoom-in of representative cells. (F) IF staining of NPM1 (red) in normal cortical rat astrocytes and in human glioma cell line U343MGa Cl2:6. (G) IB analysis of NPM1 levels in astrocytes and glioma cell lines U1242MG and U343MGa Cl2:6. β-actin served as loading control.

