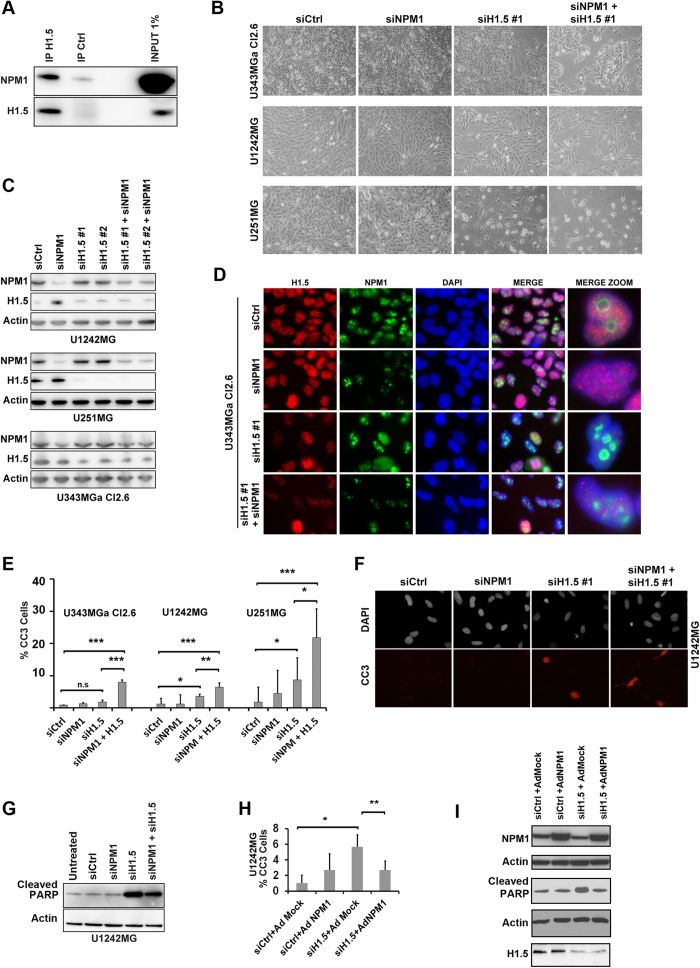
Figure 6. Depletion of linker histone H1.5 induces apoptosis in glioma cells and this is modulated by NPM1.
(A) Identification of linker histone H1.5 as an NPM1 associated protein. H1.5 co-immunoprecipitation showed increased levels of NPM1 bound to H1.5 when compared to isotype (IgG antibody) control according to IB analysis. (B) Morphological appearance of glioma cell cultures (U343MGa Cl2:6, U1242MG, and U251MG) depleted of NPM1, H1.5 or a combination. Cell cultures were transfected with siRNA targeting NPM1 (siNPM1 pool) or two different siRNA pools targeting H1.5 (siH1.5 #1 and siH1.5 #2), or combinations as indicated. For experiments in panels B-G the following time line was used: cells were treated with siNPM1 for an initial 3 days after which cells were further treated with siNPM1 and siH1.5 alongside controls for 3 days. (C) Knockdown of NPM1 and H1.5 in glioma cells as evidenced by IB analyses. (D) Knockdown of NPM1 and H1.5 in glioma cell line U343MGa Cl2:6 visualized by IF staining for H1.5 (red), NPM1 (green), and DAPI (blue). Far right panel shows zoom-in of cells representing specific cell phenotypes. (E) Quantification of (%) cells expressing cleaved caspase 3 (CC3) in control, siNPM1, siH1.5 and siNPM1+siH1.5 treated glioma cell lines. (F) IF staining of cleaved caspase 3 (CC3, red) and DAPI in cells treated with siNPM1 and siH1.5. (G) IB analysis of the amounts of cleaved PARP in cells treated with siNPM1, siH1.5 or a combination. β-actin served as loading control. (H) U1242MG cell cultures infected with NPM1 (Ad-NPM1) show decreased caspase-3 activation when compared with mock (Ad-Mock) infected cells. Shown is the average percentage of CC3+ cells for each treatment category from three independent biological replicates each in triplicate. Error bars represent standard deviation and statistical significance is indicated. Statistical analysis was done according to one way analysis of variance (ANOVA) with Tukey-Kramer post-hoc test (*P < 0.05, **P < 0.01, ***P < 0.001). (I) IB analyses of NPM1, cleaved PARP, and H1.5 levels in U1242MG cells, corresponding to the experimental set-up used in the H panel. β-actin served as loading control, note that two separate blot membranes were used.

