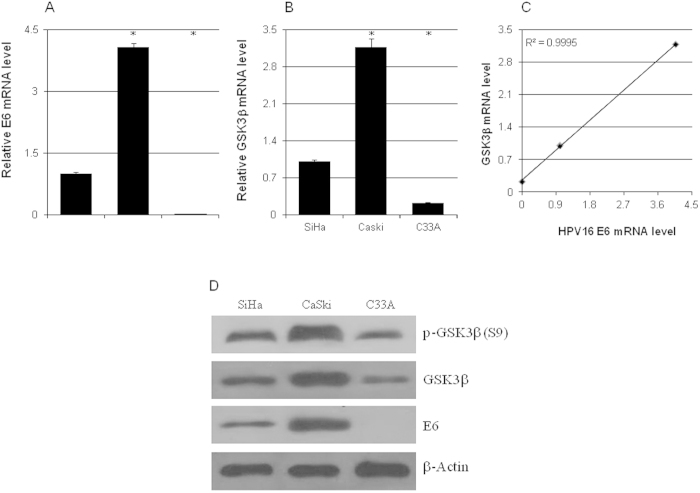
Figure 1. The expression levels of GSK3β and HPV16 E6 were correlated.
The mRNA levels of HPV16 E6 (a) and GSK3β (b) in C33A, SiHa, and CaSki cells were analyzed by quantitative real-time PCR (n = 3). (c) The correlation between the mRNA levels of GSK3β and HPV16 E6. (d) Representitative western blot results of HPV16 E6, GSK3β, and phospho-GSK3β (S9). *p < 0.01 versus control.

