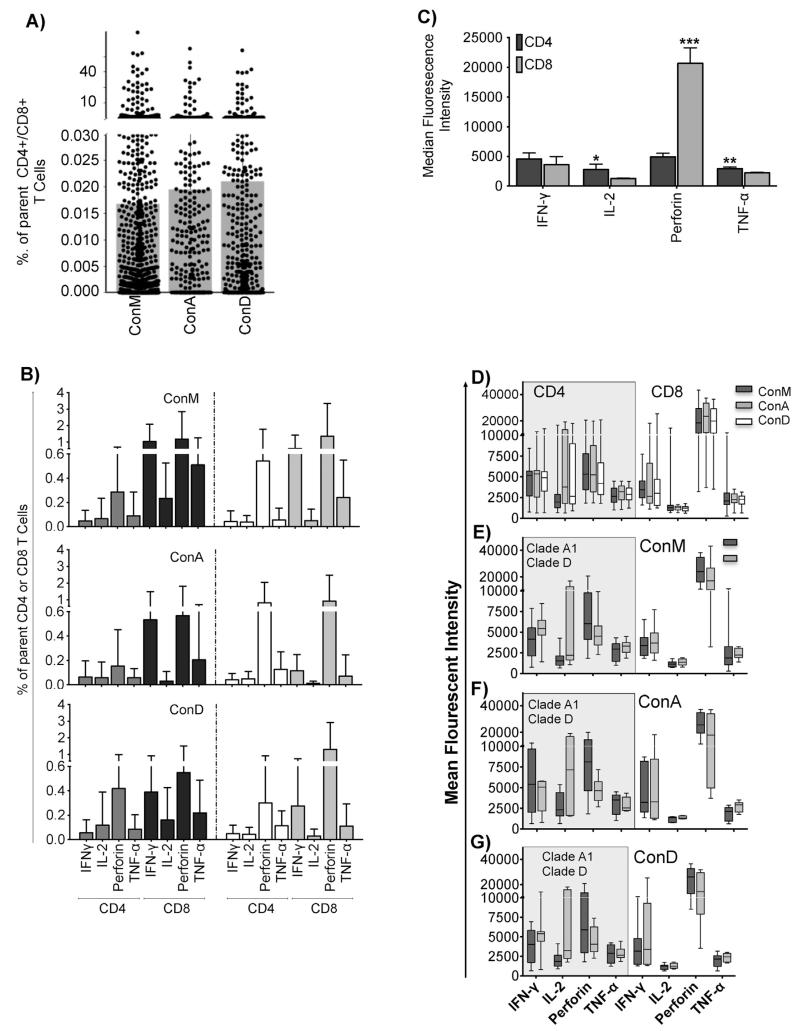
Fig. 2.
Gag-specific T cells were detected at similar frequencies across peptide sets. Magnitudes of all detected HIV-specific CD4+ and CD8+ T-cell functions (IFN-γ, IL-2, Perforin and TNF-α) are indicated in (A). The detected magnitudes were subsequently stratified according to the infecting clade, and according to the CD4+ and CD8+ parent T-cells. All bars indicate medians and interquartile ranges, (B). The overall average expression of T-cell functions (IFN-γ, IL-2, Perforin and TNF-α) in CD3+ and CD4+ T cell compartments is compared as Median Fluorescence Intensity (MFI), (C). Bars show means and standard deviations. Significant differences are highlighted as: *p ≤ 0.05, **p ≤ 0.01 and ***p ≤ 0.001; Unpaired t test. Analyses were corrected for multiple comparisons using the Sidak-Bonferroni method; hence, only p values ≤ 0.01 are considered statistically significant. Expression (MFI) of HIV-1 specific IFN-γ, IL-2, Perforin and TNF-α ni CD4+ and CD8+ T cells following stimulation with ConM, ConA and ConD is compared in (D); and is and then stratified by clade for ConM (E), ConA (F) and ConD (G).

