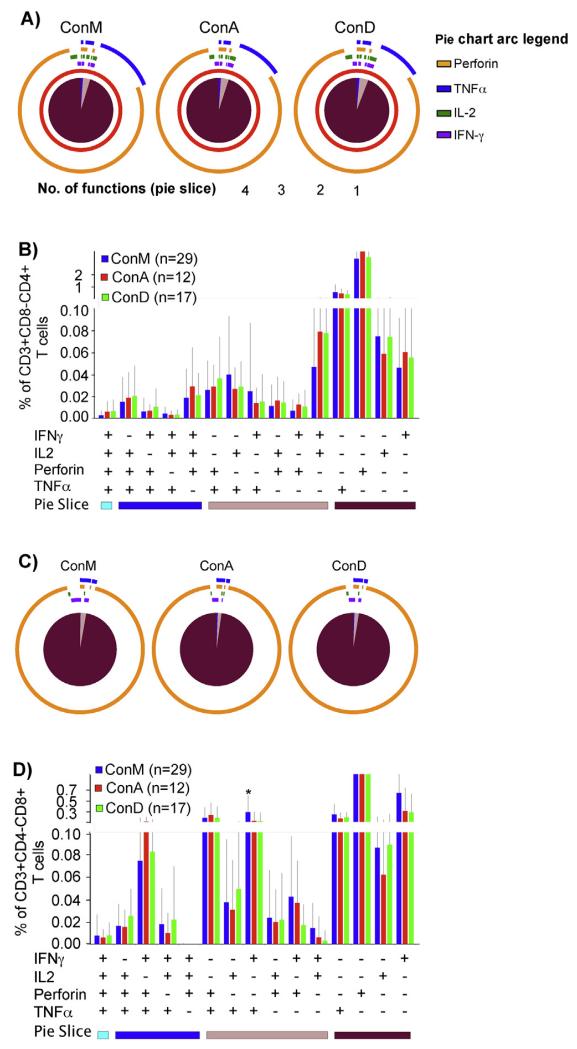
Fig. 3.
Functional Gag-specific T-cell subsets were detected at similar frequencies across peptide sets. Consensus group M, ConA and ConD Gag peptide sets were assessed for the detection of HIV-specific T-cell functions (IFN-γ, IL-2, TNF-α and Perforin) using intracellular cytokine staining assay. Virus-specific T-cell polyfunctionality was defined as the simultaneous detection of three or more functions. The pie charts in (A) show the average T-cell functionality stratified by peptide set. Pie slices represent proportions of CD3+CD8−CD4+ T-cells that detected 4 (light blue), 3 (dark blue), 2 (light brown) and 1 function (dark brown). Pie arcs represent proportions of the total CD3+CD4+ T-cell response that contains Perforin (orange arcs), TNF-α (blue arcs), IFN-γ (purple arcs) and IL-2 (green arcs). (B) illustrates the CD3+CD4+ T-cell responses detected by ConM (blue bars), ConA (red bars) and ConD peptides (green bars), and their overall distribution across 15 different functional subsets (combinations of IFN-γ, IL-2, Perforin and TNF-α functions). Bars represent means and error bars indicate standard deviations. The Y-axis represents proportions of total CD3+CD4+ T-cell response contributing a given functional profile. The X-axis represents the number of positive and negative responses contributing to a given functional profile. Similarly, proportions (C), and relative contributions of CD3+CD8+ functional T-cell responses (D) are illustrated. Significant differences between peptide sets are highlighted; * denotes p-value ≤0·05. (For interpretation of the references to color in this figure legend, the reader is referred to the web version of this article.)

