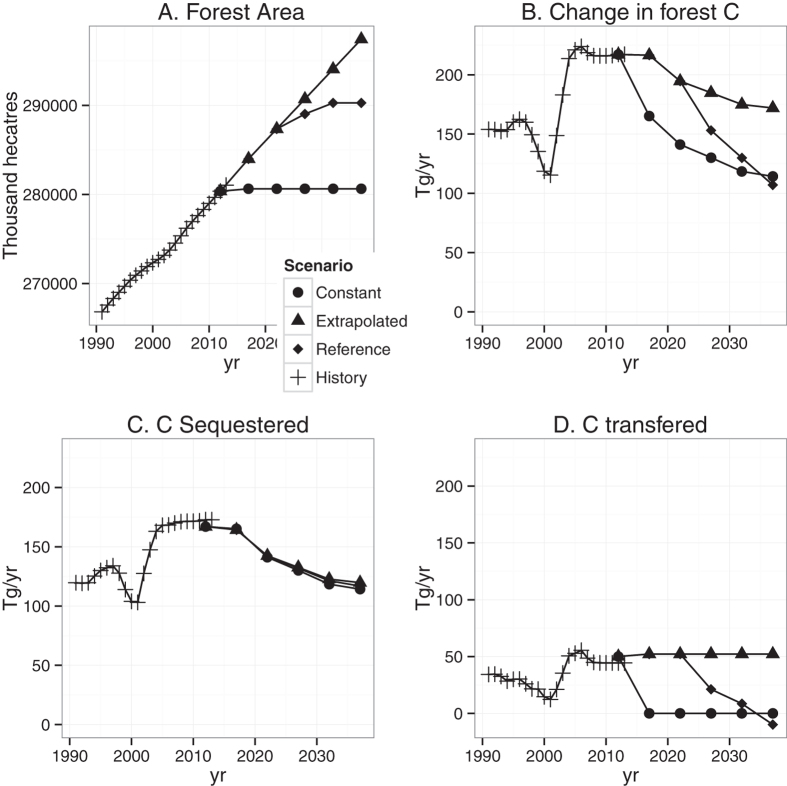
Figure 2. Projections of forest area and forest C for three scenarios.
(A) US forest area (thousand hectares), (B) annual change in the forest C stock (Tg yr−1), (C) C sequestered by forests (Tg yr−1), and (D) C transferred to other land uses (Tg yr−1) for each of three land use scenarios: Constant forest area, Extrapolated forest area (based on previous 5 years change), and the Reference Scenario (transitions from extrapolated to constant at year 2032).

