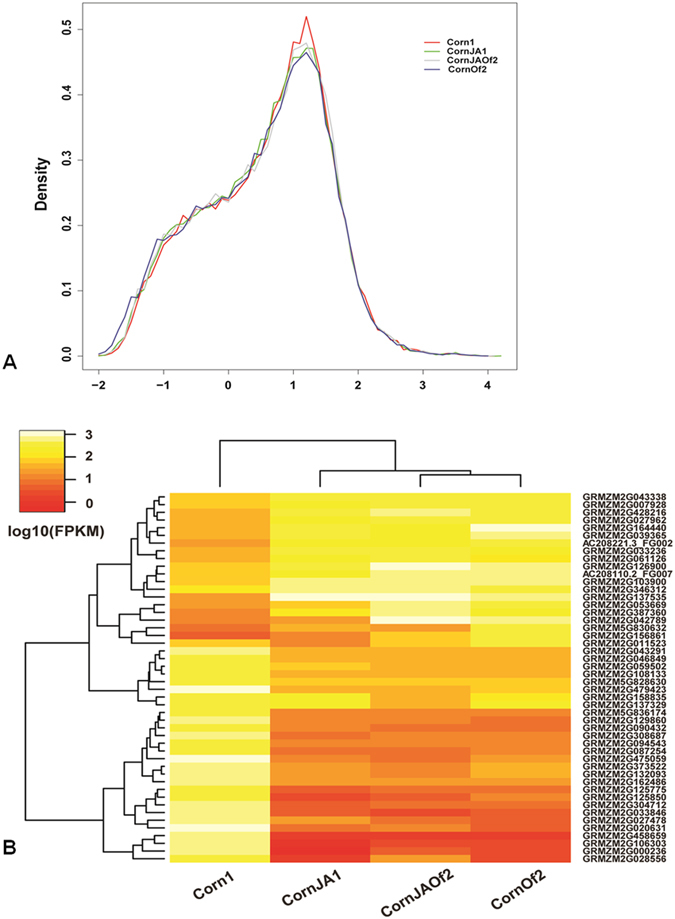
Figure 1. FPKM distribution and clustering of differentially expressed genes in each treatment.

(A) Distribution of genes according to FPKM values in CornJA1, CornOf2, and CornJAOf2 treatments and control group. Log10 (FPKM) indicates the log10 based FPKM value; genes with FPKM values between 10 and 100 are predominant. (B) Clustering of differentially expressed genes in each treatment. Forty-eight genes with FPKM ≥300 are shown. The color scale indicates gene expression level. Two major subgroups of genes were defined according to gene expression patterns in different treatments.
