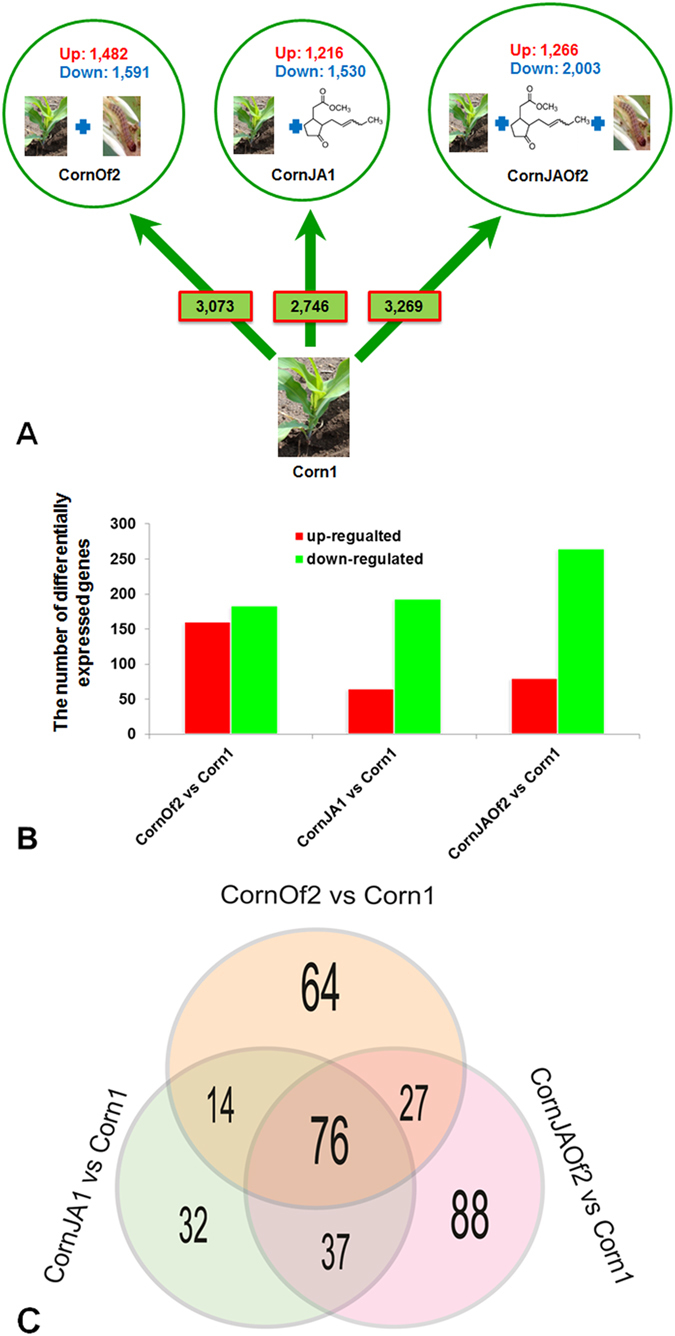
Figure 2. Number of differentially expressed genes in the three treatments.

(A) Differentially expressed genes in corn under three different treatments with FDR ≤ 0.05 and change fold ≥2, and (B) differentially expressed genes in corn under three different treatments with FDR ≤ 0.00l and change fold ≥2, and the red and green colors denote the up-regulated and down-regulated genes, respectively, and (C) the Venn diagram of common genes induced after three treatments, the significantly different (FDR ≤ 0.05) genes were defined as transcripts with fold changes ≥2 based on gene expression levels between CornJA1 and Corn1, between CornOf2 and Corn1, between CornJAOf2 and Corn1, respectively.
