Figure 2.

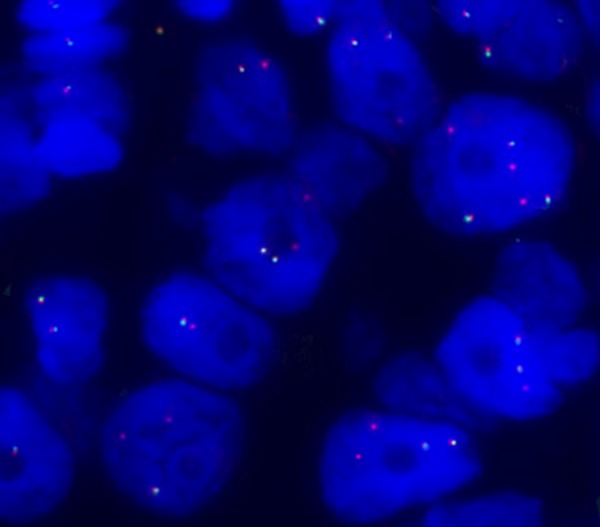
FISH analysis was performed with ALK dual-color break-apart probe labelled with SpectrumOrange (3’end) and SpectrumGreen (5’end) (Abbott Molecular). The predominant ALK-positive FISH pattern observed in the sample was isolated red signal.

FISH analysis was performed with ALK dual-color break-apart probe labelled with SpectrumOrange (3’end) and SpectrumGreen (5’end) (Abbott Molecular). The predominant ALK-positive FISH pattern observed in the sample was isolated red signal.