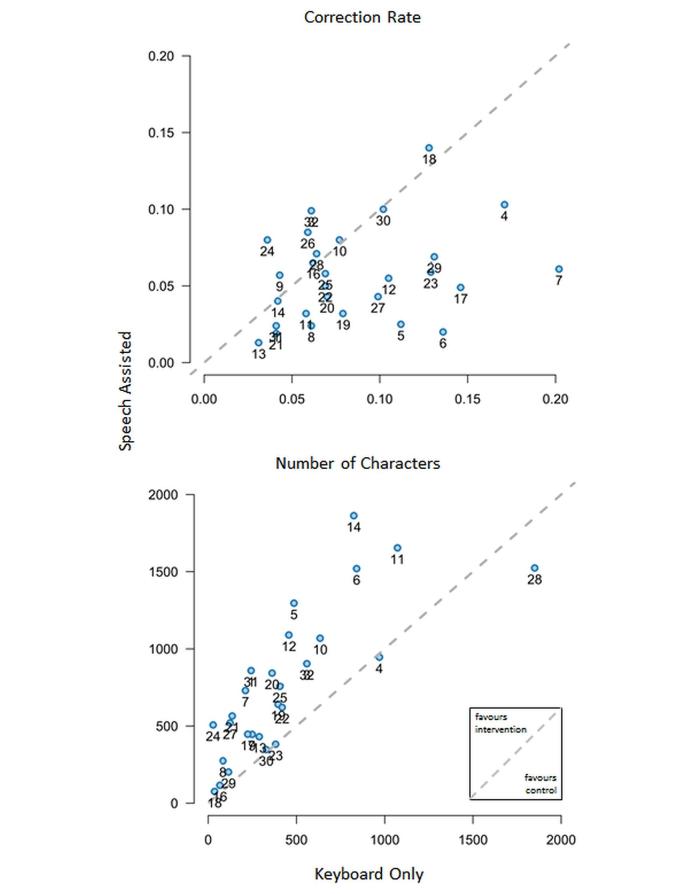
Figure 6.
Per person analysis of correction rate and number of characters. Each dot represents one participant. The location of the dot indicates the sum of corrections per documented character (see text for further details) of control and intervention and the number of characters per report of control and intervention. A location above the dotted line indicates increased correction effort and increased number of characters per report when using the intervention.

