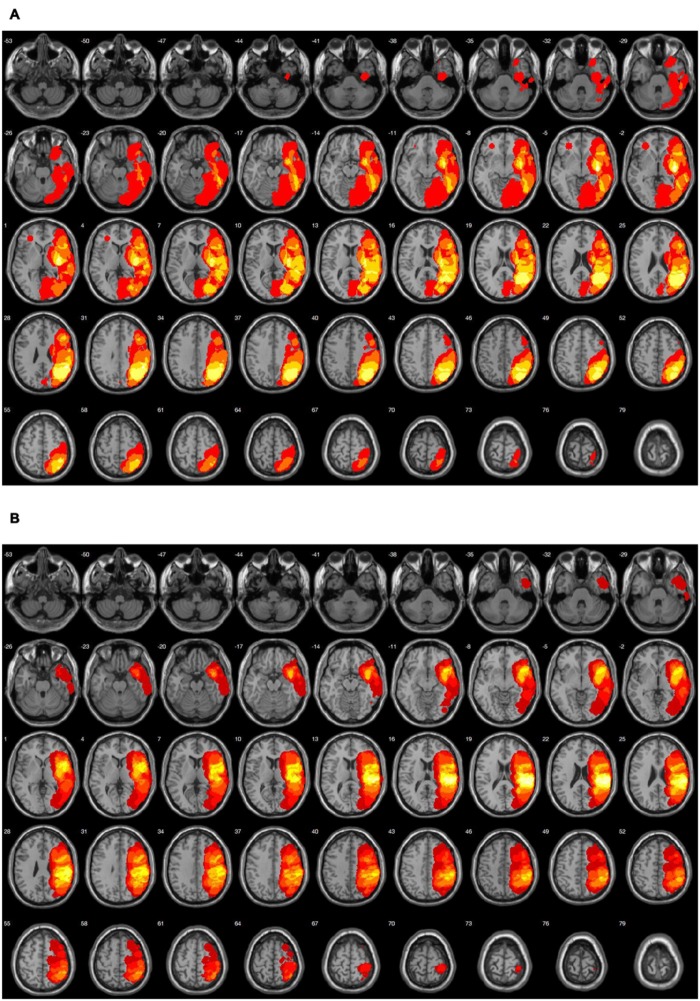
FIGURE 1.
A schematic display of the common lesioned area in Groups A and B in horizontal axis in 20 out of 28 participants. Lesions were shown with yellow/orange color. (A) Group A (n = 9): the brightest color indicates the common brain damage in five subjects. It comprises left hemispheric superior temporal gyrus, supramarginal gyrus, insula, putamen, angular gyrus. (B) Group B (n = 11): the brightest color indicates the common brain damage in nine subjects including left hemispheric superior temporal gyrus and supramarginal gyrus.

