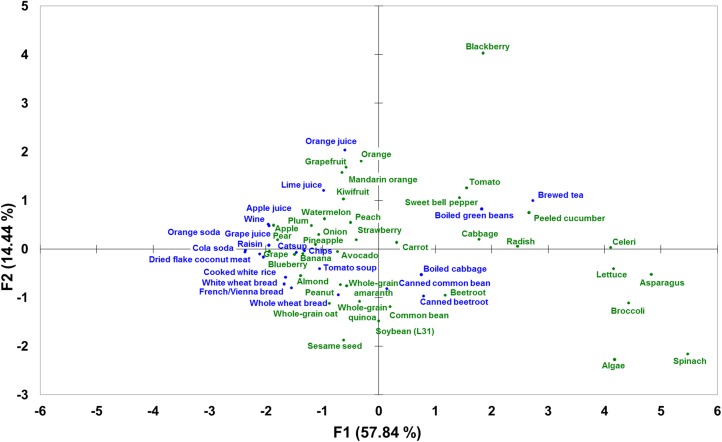
FIGURE 2.
Principal component analysis score plots derived from a 59 (food items: 38 raw, 21 processed) × 8 (lipotrope densities/100 kcal) matrix (F1 × F2 plan represents 72% of total variance). The green and blue colors on the score plot correspond to raw and processed plant-based foods, respectively (F1 and F2 are principal components 1 and 2, respectively). PAI, potentially available myo-inositol (included myo-inositol moieties derived from soluble-free myo-inositol and glycosylated myo-inositol). Reproduced from reference 45 with permission.

