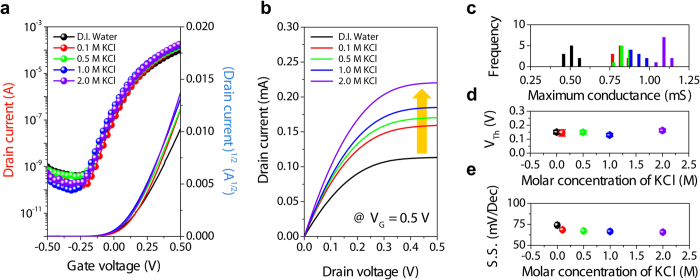
Figure 2. Electrical characteristics of IGZO-EGTFT at different salt concentrations.
Representative (a) transfer (at VD = 0.5 V) and (b) output curves (at VG = 0.5 V) of IGZO-EGTFTs employing KCl solutions with various concentrations (from 0 to 2.0 M). (c) Statistical distributions of maximum transconductance extracted from 50 different IGZO-EGTFT devices. Average values of (d) threshold voltage, and (e) subthreshold swing; error bars denote standard deviations over 10 devices.

