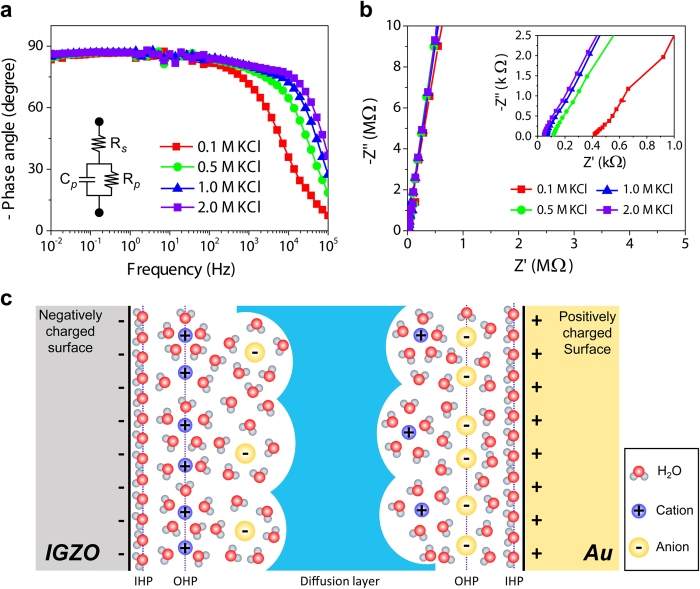
Figure 3. Electrochemical impedance analysis of IGZO/Electrolyte/Au structure.
(a) Phase-frequency plots for Au/salt-solution/IGZO/Au structures. The inset shows an equivalent circuit model composed of series and parallel resistances and a capacitor. (b) Nyquist plots at high-frequency regime showing the real (Z’) and imaginary (Z”) parts of impedance. The near-vertical straight lines indicate that there is almost no faradaic reaction on oxide surface. The inset shows magnified Nyquist plots at low impedance region indicating that series resistance or bulk solution resistance decreased with increased KCl concentration. (c) An illustration of EDLs formed at IGZO and Au surface interfacing with an aqueous salt solution. The negatively (positively) charged surface exhibits an inner Helmholtz plane (IHP) of compact water layer and an outer Helmholtz plane (OHP) of diffusive hydrated cation (anions) layer.

