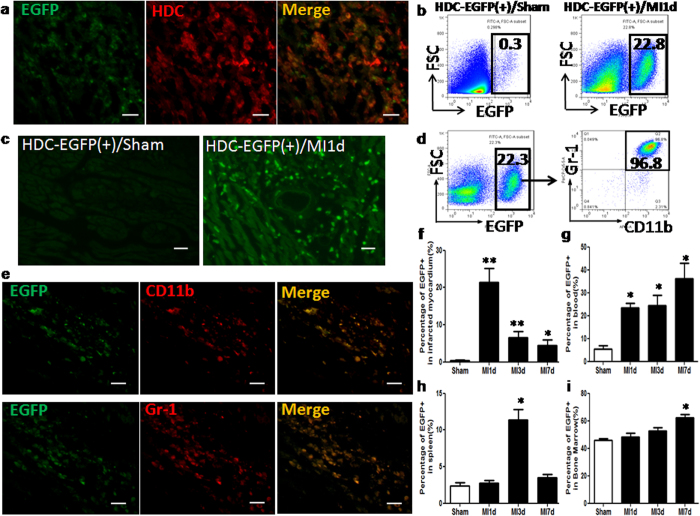
Figure 2. Identification of the cellular source of histamine during AMI.
AMI model was established in HDC-EGFP mice. (a) Immunofluorescence staining confirmed the expression of HDC in EGFP+ cells (scale bar = 20 μm). (b) At 1d post MI, FACS analysis of the increasing percentage of EGFP+ cells in the infarcted myocardium (Sham: 0.39 ± 0.13% vs MI: 21.37 ± 3.8%, p<0.01; n = 5). (c) Representative images of hearts in HDC-EGFP+ mice with MI1d compared with sham, showing a large amount of EGFP+ cells infiltration (scale bar = 20 μm). (d) FACS analysis characterized EGFP+ cells isolated from the infarcted heart with myeloid cell markers: anti-CD11b and anti-Gr-1. (e) Immunofluorescence staining showed most of EGFP+ cells (above 90%) were CD11b+ and Gr-1+ immature myeloid cells (scale bar = 20 μm). (f–i) The expression patterns of EGFP+ cells over time in the infarcted myocardium examined by FACS. (f) in the myocardium, (g) in the blood, (h) in the spleen, (i) in the bone marrow are shown (**p < 0.01 vs Sham, *p < 0.05 vs Sham; n = 5–8).

