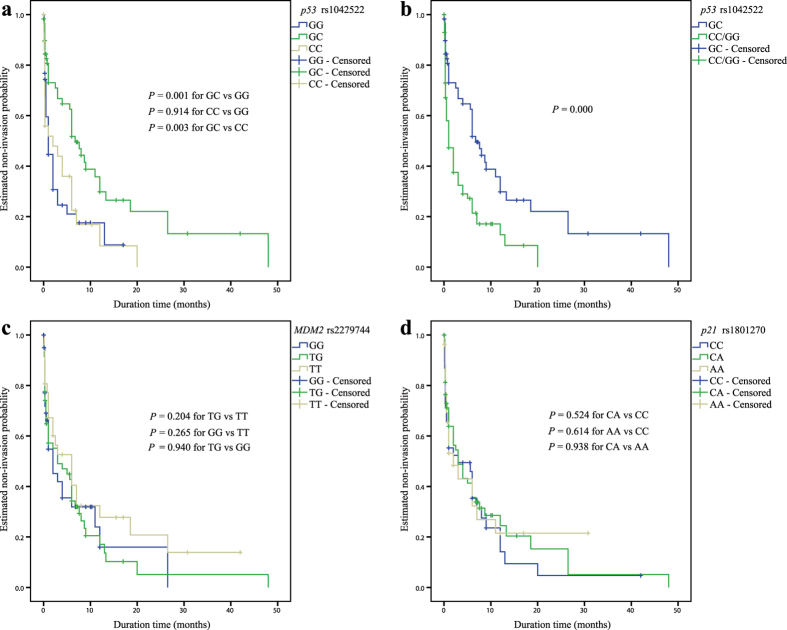
Figure 2. Kaplan-Meier analysis of the association of the selected SNPs of p53 pathway genes with event-free survival (EFS) for RB invasion among enucleated patients.
(a) Cumulative EFS curve of the enucleated patients for the three genotypes of p53 rs1042522 (P = 0.001 for GC versus GG, P = 0.914 for CC versus GG, and P = 0.003 for GC versus CC); (b) Cumulative EFS curve of enucleated patients according to the over-dominant genetic model of p53 rs1042522 (P = 0.000 for GC versus GG/CC). (c) Cumulative EFS curve of enucleated patients according to the three genotypes of MDM2 rs2279744 (P = 0.204 for TG versus TT, P = 0.265 for GG versus TT, and P = 0.940 for TG versus GG); (d) Cumulative EFS curve of enucleated patients according to the three genotypes of p21 rs1801270 (P = 0.524 for CA versus CC, P = 0.614 for AA versus CC, and P = 0.938 for CA versus AA).

