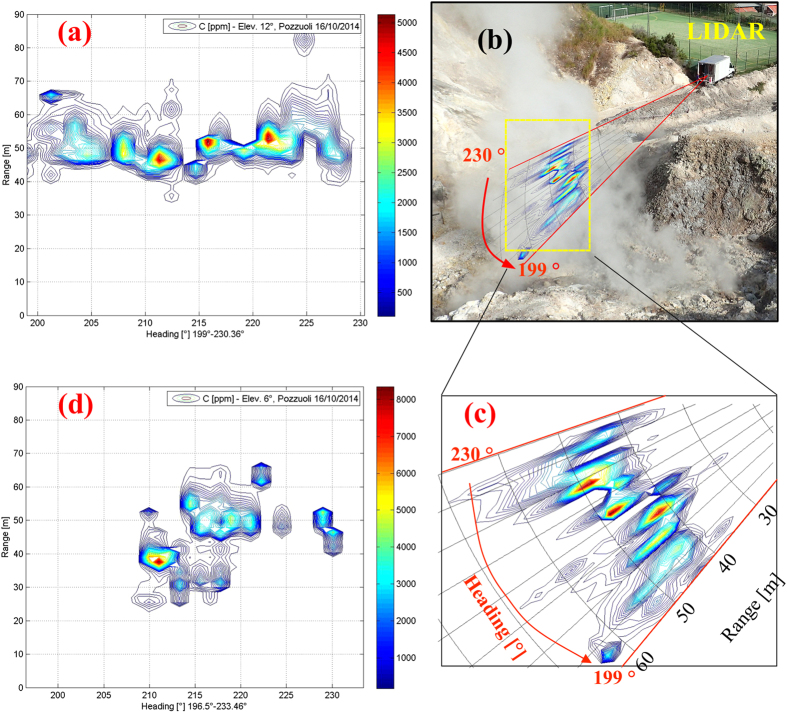
Figure 3.
(a) An example of a lidar scan through the plume at an elevation of 12° (from October 16, 2014). The contour lines show isopleths of background-corrected CO2 mixing ratios in the plume (expressed in ppmv, the legend is the vertical colored bar), shown as a function of heading (horizontal scale) and range (vertical scale). The plume appears as a cluster of CO2 concentration peaks at heading angles of 205–225° and ranges of 40 to 60 m from the lidar. At lower (<205°) and higher (>225°) heading angles, and at ranges of <40 and >60 m, CO2 mixing ratios corresponding to those for ambient air are obtained. (b) Same as (a) but in polar coordinates. A photo of the Pisciarelli area (by C. Minopoli) is shown in the background to illustrate the correspondence between the CO2 anomaly and the main degassing areas. (c) Zoomed image of (b), in which the plume is clearly visible at ranges of 40–50 m. (d) For comparison, an example lidar scan through the plume at a lower elevation (6°), showing a narrower and less-dispersed plume.

