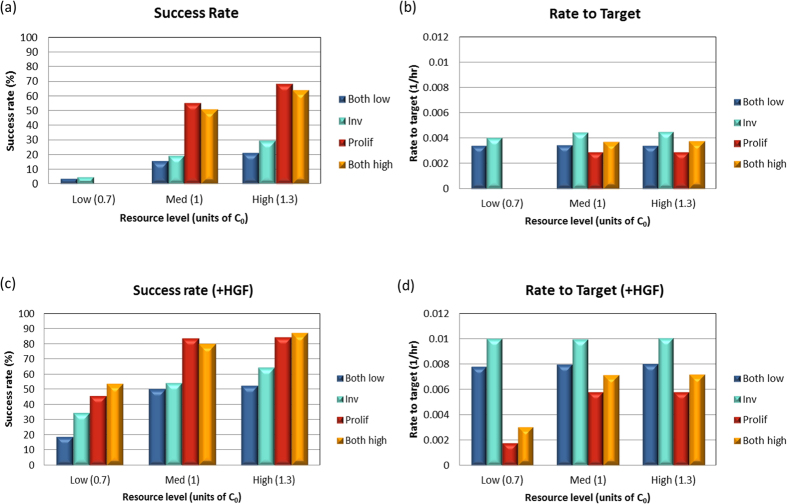
Figure 4. Assessment of cellular performance.
We measured the maze success rates (a,c) and the passage rate (b,d) of four different phenotypes: with high proliferation rate, high invasion rate, both low and both high. Three different environmental resource levels were tested, compared to the optimal glucose concentration C0 (see main text). (a,b) with no HGF stimulation; (c,d) with HGF stimulation. Error bars (a,c) indicate +/– standard deviation. 1000 simulation runs were performed for each case.

