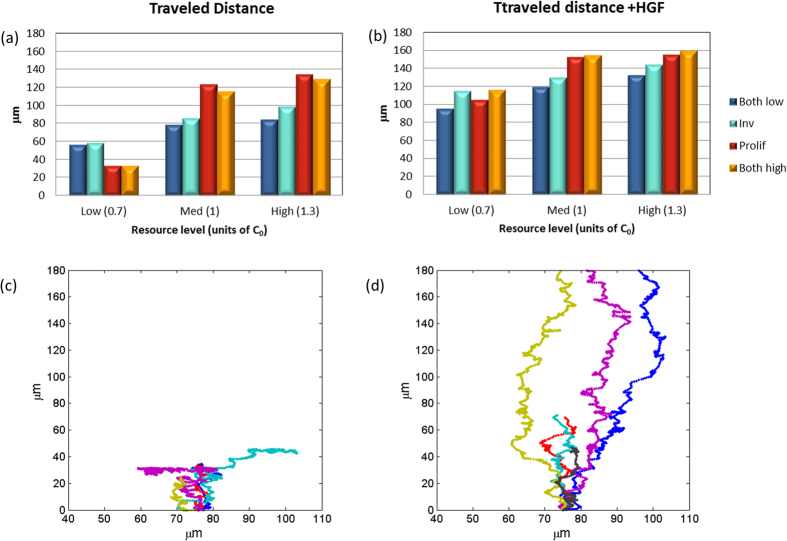
Figure 5. Overall cell scattering.
(a,b) The average distance (in μm) traveled by all the cells during the simulation time, both successful and unsuccessful: (a) with no HGF stimulation, and (b) with HGF stimulation (see text and Fig. 4 for more details). (c,d) Individual trajectories of simulated proliferative cells under low resource conditions, (c) with no HGF stimulation, and (d) with HGF stimulation.

